Mercator projection
Nowadays the Mercator projection is widely used because, aside from marine navigation, it is well suited for internet web maps.
Joseph Needham, a historian of China, speculated that some star charts of the Chinese Song dynasty may have been drafted on the Mercator projection;[1] however, this claim was presented without evidence, and astronomical historian Kazuhiko Miyajima concluded using cartometric analysis that these charts used an equirectangular projection instead.
[3] [4] The charts have startling accuracy not found in the maps constructed by contemporary European or Arab scholars, and their construction remains enigmatic; based on cartometric analysis which seems to contradict the scholarly consensus, they have been speculated to have originated in some unknown pre-medieval cartographic tradition, possibly evidence of some ancient understanding of the Mercator projection.
[5] German polymath Erhard Etzlaub engraved miniature "compass maps" (about 10×8 cm) of Europe and parts of Africa that spanned latitudes 0°–67° to allow adjustment of his portable pocket-size sundials.
[7] Portuguese mathematician and cosmographer Pedro Nunes first described the mathematical principle of the rhumb line or loxodrome, a path with constant bearing as measured relative to true north, which can be used in marine navigation to pick which compass bearing to follow.
In 1537, he proposed constructing a nautical atlas composed of several large-scale sheets in the equirectangular projection as a way to minimize distortion of directions.
In 1541, Flemish geographer and mapmaker Gerardus Mercator included a network of rhumb lines on a terrestrial globe he made for Nicolas Perrenot.
[8] In 1569, Mercator announced a new projection by publishing a large world map measuring 202 by 124 cm (80 by 49 in) and printed in eighteen separate sheets.
Mercator titled the map Nova et Aucta Orbis Terrae Descriptio ad Usum Navigantium Emendata: "A new and augmented description of Earth corrected for the use of sailors".
[9] English mathematician Edward Wright published the first accurate tables for constructing the projection in 1599 and, in more detail, in 1610, calling his treatise "Certaine Errors in Navigation".
Only in the middle of the 18th century, after the marine chronometer was invented and the spatial distribution of magnetic declination was known, could the Mercator projection be fully adopted by navigators.
However, it did not begin to dominate world maps until the 19th century, when the problem of position determination had been largely solved.
Once the Mercator became the usual projection for commercial and educational maps, it came under persistent criticism from cartographers for its unbalanced representation of landmasses and its inability to usefully show the polar regions.
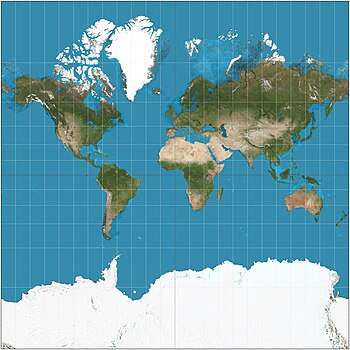
As for all cylindrical projections in normal aspect, circles of latitude and meridians of longitude are straight and perpendicular to each other on the map, forming a grid of rectangles.
While circles of latitude on the Earth are smaller the closer they are to the poles, they are stretched in an East–West direction to have uniform length on any cylindrical map projection.
The Mercator projection exaggerates areas far from the equator; the closer to the poles of the Earth, the greater the distortion.
Because of great land area distortions, critics like George Kellaway and Irving Fisher consider the projection unsuitable for general world maps.
In response, a 1989 resolution by seven North American geographical groups disparaged using cylindrical projections for general-purpose world maps, which would include both the Mercator and the Gall–Peters.
[19] Practically every marine chart in print is based on the Mercator projection due to its uniquely favorable properties for navigation.
[21] The Mercator projection was designed for use in marine navigation because of its unique property of representing any course of constant bearing as a straight segment.
For small distances (compared to the radius of the Earth), the difference between the rhumb and the great circle course is negligible.
Sailing a rhumb meant that all that the sailors had to do was keep a constant course as long as they knew where they were when they started, where they intended to be when they finished, and had a map in Mercator projection that correctly showed those two coordinates.
The major online street mapping services' tiling systems display most of the world at the lowest zoom level as a single square image, excluding the polar regions by truncation at latitudes of φmax = ±85.05113°.
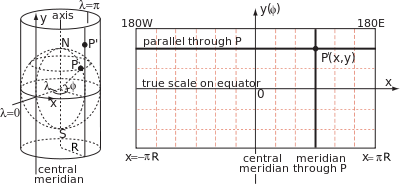
This spherical approximation of Earth can be modelled by a smaller sphere of radius R, called the globe in this section.
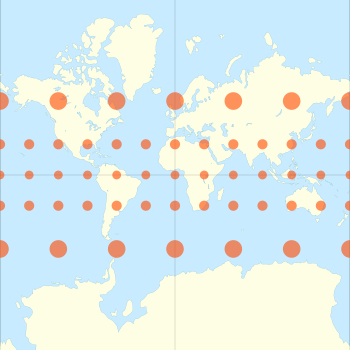
[29][c] For the Mercator projection, h = k, so the ellipses degenerate into circles with radius proportional to the value of the scale factor for that latitude.
[31] Corresponding inverses are: For angles expressed in degrees: The above formulae are written in terms of the globe radius R. It is often convenient to work directly with the map width W = 2πR.
For example, the basic transformation equations become The ordinate y of the Mercator projection becomes infinite at the poles and the map must be truncated at some latitude less than ninety degrees.
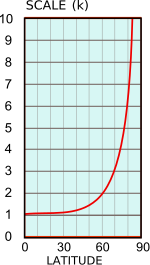
For a ruler measurement of a short line, with midpoint at latitude φ, where the scale factor is k = sec φ = 1/cos φ: With radius and great circle circumference equal to 6,371 km and 40,030 km respectively an RF of 1/300M, for which R = 2.12 cm and W = 13.34 cm, implies that a ruler measurement of 3 mm.
The difference is 3,338 km so the ruler distance measured from the map is quite misleading even after correcting for the latitude variation of the scale factor.
[e] When the Earth is modelled by a spheroid (ellipsoid of revolution) the Mercator projection must be modified if it is to remain conformal.