Margin of error
The margin of error is a statistic expressing the amount of random sampling error in the results of a survey.
The larger the margin of error, the less confidence one should have that a poll result would reflect the result of a census of the entire population.
The margin of error will be positive whenever a population is incompletely sampled and the outcome measure has positive variance, which is to say, whenever the measure varies.
The term margin of error is often used in non-survey contexts to indicate observational error in reporting measured quantities.
is to the true result of a survey of the entire population
, the true but unknown percentage of the population.
The margin of error describes the distance within which a specified percentage of these results is expected to vary from
Going by the Central limit theorem, the margin of error helps to explain how the distribution of sample means (or percentage of yes, in this case) will approximate a normal distribution as sample size increases.
If this applies, it would speak about the sampling being unbiased, but not about the inherent distribution of the data.
of a population having expected standard deviation
denotes the quantile (also, commonly, a z-score), and
We would expect the average of normally distributed values
For the single result from our survey, we assume that
corresponds to the variance of a Bernoulli distribution.
, there is a corresponding confidence interval about the mean
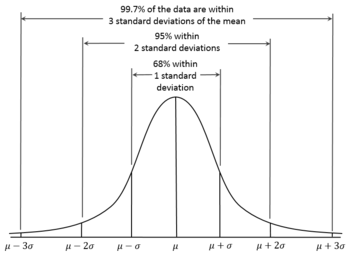
are given by the quantile function of the normal distribution (which the 68–95–99.7 rule approximates).
to obtain the maximum margin of error for
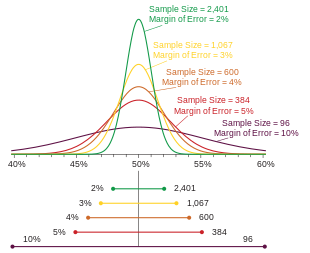
If a poll has multiple percentage results (for example, a poll measuring a single multiple-choice preference), the result closest to 50% will have the highest margin of error.
Typically, it is this number that is reported as the margin of error for the entire poll.
As described above, the margin of error reported for the poll would typically be
The popular notion of statistical tie or statistical dead heat, however, concerns itself not with the accuracy of the individual results, but with that of the ranking of the results.
, we could use the standard error of difference to understand how
close to perfectly negatively correlated).
With three or more choices in closer contention, choosing a correct formula for
The formulae above for the margin of error assume that there is an infinitely large population and thus do not depend on the size of population
The margin of error for a particular sampling method is essentially the same regardless of whether the population of interest is the size of a school, city, state, or country, as long as the sampling fraction is small.
In cases where the sampling fraction is larger (in practice, greater than 5%), analysts might adjust the margin of error using a finite population correction to account for the added precision gained by sampling a much larger percentage of the population.
FPC can be calculated using the formula[2] ...and so, if poll
were conducted over 24% of, say, an electorate of 300,000 voters, Intuitively, for appropriately large
In the latter case, the poll effectively becomes a census and sampling error becomes moot.
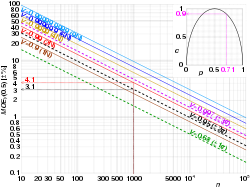

The inset parabola illustrates the relationship between at and at . In the example, MOE 95 (0.71) ≈ 0.9 × ±3.1% ≈ ±2.8%.


