Probability density function
In probability theory, a probability density function (PDF), density function, or density of an absolutely continuous random variable, is a function whose value at any given sample (or point) in the sample space (the set of possible values taken by the random variable) can be interpreted as providing a relative likelihood that the value of the random variable would be equal to that sample.
[2][3] Probability density is the probability per unit length, in other words, while the absolute likelihood for a continuous random variable to take on any particular value is 0 (since there is an infinite set of possible values to begin with), the value of the PDF at two different samples can be used to infer, in any particular draw of the random variable, how much more likely it is that the random variable would be close to one sample compared to the other sample.
This probability is given by the integral of this variable's PDF over that range—that is, it is given by the area under the density function but above the horizontal axis and between the lowest and greatest values of the range.
The probability density function is nonnegative everywhere, and the area under the entire curve is equal to 1.
This quantity 2 hour−1 is called the probability density for dying at around 5 hours.
Therefore, the probability that the bacterium dies at 5 hours can be written as (2 hour−1) dt.
A probability density function is most commonly associated with absolutely continuous univariate distributions.
The probability mass function of a discrete random variable is the density with respect to the counting measure over the sample space (usually the set of integers, or some subset thereof).
It is possible to represent certain discrete random variables as well as random variables involving both a continuous and a discrete part with a generalized probability density function using the Dirac delta function.
(This is not possible with a probability density function in the sense defined above, it may be done with a distribution.)
For example, consider a binary discrete random variable having the Rademacher distribution—that is, taking −1 or 1 for values, with probability 1⁄2 each.
More generally, if a discrete variable can take n different values among real numbers, then the associated probability density function is:
This substantially unifies the treatment of discrete and continuous probability distributions.
The above expression allows for determining statistical characteristics of such a discrete variable (such as the mean, variance, and kurtosis), starting from the formulas given for a continuous distribution of the probability.
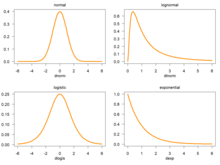
For example, the normal distribution is parametrized in terms of the mean and the variance, denoted by
Different values of the parameters describe different distributions of different random variables on the same sample space (the same set of all possible values of the variable); this sample space is the domain of the family of random variables that this family of distributions describes.
A given set of parameters describes a single distribution within the family sharing the functional form of the density.
From the perspective of a given distribution, the parameters are constants, and terms in a density function that contain only parameters, but not variables, are part of the normalization factor of a distribution (the multiplicative factor that ensures that the area under the density—the probability of something in the domain occurring— equals 1).
For continuous random variables X1, ..., Xn, it is also possible to define a probability density function associated to the set as a whole, often called joint probability density function.
Continuous random variables X1, ..., Xn admitting a joint density are all independent from each other if
This is also called a "change of variable" and is in practice used to generate a random variable of arbitrary shape fg(X) = fY using a known (for instance, uniform) random number generator.
The values of the two integrals are the same in all cases in which both X and g(X) actually have probability density functions.
This follows from the fact that the probability contained in a differential area must be invariant under change of variables.
which is an upper triangular matrix with ones on the main diagonal, therefore its determinant is 1.
Applying the change of variable theorem from the previous section we obtain that
It is possible to generalize the previous relation to a sum of N independent random variables, with densities U1, ..., UN:
To compute the quotient Y = U/V of two independent random variables U and V, define the following transformation:
The above transformation meets this because Z can be mapped directly back to V, and for a given V the quotient U/V is monotonic.
This is similarly the case for the sum U + V, difference U − V and product UV.
Exactly the same method can be used to compute the distribution of other functions of multiple independent random variables.