Mark and recapture
Mark and recapture is a method commonly used in ecology to estimate an animal population's size where it is impractical to count every individual.
Later, another portion will be captured and the number of marked individuals within the sample is counted.
The method assumes, rightly or wrongly, that the probability of capture is the same for all individuals.
Another major application for these methods is in epidemiology,[4] where they are used to estimate the completeness of ascertainment of disease registers.
Typical applications include estimating the number of people needing particular services (e.g. services for children with learning disabilities, services for medically frail elderly living in the community), or with particular conditions (e.g. illegal drug addicts, people infected with HIV, etc.).
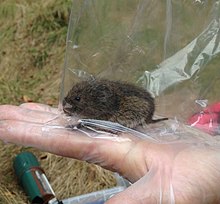
[5] Typically a researcher visits a study area and uses traps to capture a group of individuals alive.
Each of these individuals is marked with a unique identifier (e.g., a numbered tag or band), and then is released unharmed back into the environment.
Johannes Petersen to estimate plaice, Pleuronectes platessa, populations.
[2] Sufficient time should be allowed to pass for the marked individuals to redistribute themselves among the unmarked population.
Commonly, more than two visits are made, particularly if estimates of survival or movement are desired.
Regardless of the total number of visits, the researcher simply records the date of each capture of each individual.
The "capture histories" generated are analyzed mathematically to estimate population size, survival, or movement.
She captures 10 turtles on her first visit to the lake, and marks their backs with paint.
It has been shown that this confidence interval has actual coverage probabilities that are close to the nominal
[10] The mean value ± standard deviation is where A derivation is found here: Talk:Mark and recapture#Statistical treatment.
The example (n, K, k) = (10, 15, 5) gives the estimate N ≈ 42 ± 21.5 The capture probability refers to the probability of a detecting an individual animal or person of interest,[11] and has been used in both ecology and epidemiology for detecting animal or human diseases,[12] respectively.
The capture probability is often defined as a two-variable model, in which f is defined as the fraction of a finite resource devoted to detecting the animal or person of interest from a high risk sector of an animal or human population, and q is the frequency of time that the problem (e.g., an animal disease) occurs in the high-risk versus the low-risk sector.
[13] For example, an application of the model in the 1920s was to detect typhoid carriers in London, who were either arriving from zones with high rates of tuberculosis (probability q that a passenger with the disease came from such an area, where q>0.5), or low rates (probability 1−q).
Importantly, the formula can be re-written as a linear equation in terms of f: Because this is a linear function, it follows that for certain versions of q for which the slope of this line (the first term multiplied by f) is positive, all of the detection resource should be devoted to the high-risk population (f should be set to 1 to maximize the capture probability), whereas for other value of q, for which the slope of the line is negative, all of the detection should be devoted to the low-risk population (f should be set to 0.
[13] In more complex cases, where more than one resource f is devoted to more than two areas, multivariate optimization is often used, through the simplex algorithm or its derivatives.
The literature on the analysis of capture-recapture studies has blossomed since the early 1990s[citation needed].
Sophisticated mark-recapture models can be fit with several packages for the Open Source R programming language.
[20] Other related methods which are often used include the Jolly–Seber model (used in open populations and for multiple census estimates) and Schnabel estimators[21] (an expansion to the Lincoln–Petersen method for closed populations).
The integrated approach is more computationally demanding, but extracts more information from the data improving parameter and uncertainty estimates.