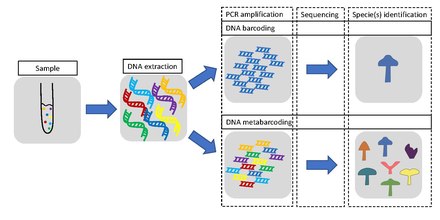
Metabarcoding
[2] The metabarcoding procedure, like general barcoding, proceeds in order through stages of DNA extraction, PCR amplification, sequencing and data analysis.
eDNA may come from skin, mucous, saliva, sperm, secretions, eggs, feces, urine, blood, roots, leaves, fruit, pollen, and rotting bodies of larger organisms, while microorganisms may be obtained in their entirety.
[11][12][13] Ecosystem-wide applications of eDNA metabarcoding have the potential to not only describe communities and biodiversity, but also to detect interactions and functional ecology over large spatial scales, though it may be limited by false readings due to contamination or other errors.
[7][14][12][9] Altogether, eDNA metabarcoding increases speed, accuracy, and identification over traditional barcoding and decreases cost, but needs to be standardized and unified, integrating taxonomy and molecular methods for full ecological study.
[13] The difference in source material between community DNA and eDNA therefore has distinct ramifications for interpreting the scale of inference for time and space about the biodiversity detected.
Ideally, these barcodes need to be generated from vouchered specimens deposited in a publicly accessible place, such as for instance a natural history museum or another research institute.
[43][44] Modern next-generation sequencing (NGS) technologies can handle thousands to millions reads in parallel and are therefore suitable for mass identification of a mix of different species present in a substrate, summarized as metabarcoding.
[30] Despite the obvious power of the approach, eDNA metabarcoding is affected by precision and accuracy challenges distributed throughout the workflow in the field, in the laboratory and at the keyboard.
[47] As set out in the diagram at the right, following the initial study design (hypothesis/question, targeted taxonomic group etc) the current eDNA workflow consists of three components: field, laboratory and bioinformatics.
For animals, algae and fungi, a portion of a mitochondrial gene which codes for subunit 1 of the cytochrome oxidase enzyme, CO1, has provided high percentages (95%), a region around 648 base pairs.
By detecting numerous additional hidden interactions, metabarcoding data largely alters the properties of the pollination networks compared to visit surveys.
[56] Understanding the responses of pollination networks to these declines is urgently required to diagnose the risks the ecosystems may incur as well as to design and evaluate the effectiveness of conservation actions.
[57] Early studies on animal pollination dealt with simplified systems, i.e. specific pairwise interactions or involved small subsets of plant-animal communities.
[86][77] In food web ecology, "who eats whom" is a fundamental issue for gaining a better understanding of the complex trophic interactions existing between pests and their natural enemies within a given ecosystem.
[77] The diagram on the right summarises results from a 2020 study which used metabarcoding to untangle the functional diversity and structure of the food web associated with a couple of millet fields in Senegal.
[77] Conserving functional biodiversity and related ecosystem services, especially by controlling pests using their natural enemies, offers new avenues to tackle challenges for the sustainable intensification of food production systems.
[100] In marine systems, NIS that survive the transport and adapt to new locations can have significant adverse effects on local biodiversity, including the displacement of native species, and shifts in biological communities and associated food webs.
[101][102] Once NIS are established, they are extremely difficult and costly to eradicate,[103][104] and further regional spread may occur through natural dispersal or via anthropogenic transport pathways.
[99] Recent studies have revealed that the water and associated debris entrained in bilge spaces of small vessels (<20 m) can act as a vector for the spread of NIS at regional scales.
It can accumulate on or below the vessel’s deck (e.g., under floor panels) through a variety of mechanisms, including wave actions, leaks, via the propeller stern glands, and through the loading of items such as diving, fishing, aquaculture or scientific equipment.
[116] Bilge water, therefore, may contain seawater as well as living organisms at various life stages, cell debris and contaminants (e.g., oil, dirt, detergent, etc.
[99] In 2017, Fletcher et al. used a combination of laboratory and field experiments to investigate the diversity, abundance, and survival of biological material contained in bilge water samples taken from small coastal vessels.
[115] Their laboratory experiment showed that ascidian colonies or fragments, and bryozoan larvae, can survive passage through an unfiltered pumping system largely unharmed.
They also conducted the first morpho-molecular assessment (using eDNA metabarcoding) on the biosecurity risk posed by bilge water discharges from 30 small vessels (sailboats and motorboats) of various origins and sailing time.
Using eDNA metabarcoding they characterised approximately three times more taxa than via traditional microscopic methods, including the detection of five species recognised as non-indigenous in the study region.
[99] To assist in understanding the risks associated with different NIS introduction vectors, traditional microscope biodiversity assessments are increasingly being complemented by eDNA metabarcoding.
[124] Extracellular DNA can persist in dark/cold environments for extended periods of time (months to years,[125][126] thus many of the organisms detected using eDNA metabarcoding may have not been viable in the location of sample collection for days or weeks.
[146] However, there are current joined attempts, such as the COST network DNAqua-Net of the European Cooperation in Science and Technology,[147] to move forward by exchanging experience and knowledge to establish best-practice standards for biomonitoring.
[149][150] However, scientists such as Rob DeSalle have expressed concern that classical taxonomy and DNA barcoding, which they consider a misnomer, need to be reconciled, as they delimit species differently.
As a rule of thumb, microbiologists have assumed that kinds of Bacteria or Archaea with 16S ribosomal RNA gene sequences more similar than 97% to each other need to be checked by DNA-DNA hybridisation to decide if they belong to the same species or not.


with environmental DNA metabarcoding [ 10 ]


of an environmental DNA metabarcoding study [ 13 ]


b) Beta diversity patterns illustrated via Principal Coordinate Analyses carried out in QIIME , [ 48 ] where each dot represents a sample and colors distinguish different classes of sample. The closer two sample points in 3D space, the more similar their community assemblages
c) GraPhalAn phylogenetic visualization of environmental data, with circular heatmaps and abundance bars used to convey quantitative taxon traits. [ 49 ]
d) Edge PCA, a tree‐based diversity metric that identifies specific lineages (green/orange branches) that contribute most to community changes observed in samples distributed across different PCA axes. [ 50 ] [ 51 ]

(A) Trophic network:
of arthropod and vertebrate predators – arrows represent biomass flow between predators and preys.
(B) Intraguild interactions: * Arthropod predators * Parasitoids of arthropods: * Insectivorous vertebrates: [ 77 ]

