Natural gas in the United States
Because of the greater supply, consumer prices for natural gas are significantly lower in the United States than in Europe and Japan.
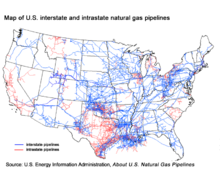
The United States oil and gas industry is often informally divided into "upstream" (exploration and production), "midstream" (transportation and refining), and "downstream" (distribution and marketing).
Sometimes gas containing 5.8 million BTU is defined as a "barrel of oil equivalent for energy calculation purposes.
Hydrocarbon compounds from hexane (each molecule of which is a simple chain containing six carbon atoms, hence called C6) and heavier generally separate out ("condense") from the gas at the wellhead; this mixture is called condensate, and is usually reported as oil production, and sold to refineries the same as oil.
[22] As of 2015, the reduction in NGL prices had turned North America from one of the high-cost places to manufacture petrochemical, into the lowest-cost area outside the Middle East.
Sulfur, which must be removed from natural gas for safety, aesthetic, and environmental reasons, is recovered and sold as a byproduct.
Unlike residential, commercial, and industrial use, all of which are higher in winter, electrical power generation uses more gas in the summer.
In 2014, 46% of the marketed gas was used by commercial and industrial users, 33% by electrical power generators, and 21% by residential consumers.
In late 2015, natural gas surpassed coal as the largest source of electricity generated in the United States.
First, pressure on utilities to decrease greenhouse gas emissions has favored the substitution of coal generation by natural gas generation, which, according to the National Renewable Energy Laboratory,[30] and the IPCC,[31] has significantly less life-cycle GHG emissions than coal-powered electricity.
[32] Third, since late 2008, the price of natural gas has been relatively cheap on the North American market, especially compared to oil.
The states which use the most natural gas for electricity production are, in descending order, Texas, Florida, California, and New York.
The gas was carried in cast iron pipes, introduced in 1843, typically with bell-and-spigot joints sealed with rope and molten lead.
The prices charged by utilities delivering natural gas to customers have always been subject to state regulation.
Congress passed the Natural Gas Act of 1938 to regulate the rates charged by interstate pipelines.
By the early 1970s, the artificially low price set by the federal government had created a shortage, but only of interstate gas.
In 1975 and 1976, some schools and factories in the Midwest shut down periodically when the local utility could not find any natural gas to buy at the controlled price.
The Federal Power Commission tried to allocate the scarce gas by identifying "high-priority" and "low-priority" customers, but this caused extensive litigation.
As with petroleum, the future supply of natural gas has long been the subject of concern, and predictions of shortages.
In 1952, Dr. Edward Steidle, Dean of the School of Mineral Industries at Pennsylvania State College, predicted that gas production would soon decline significantly from 1952 rates, so that gas would cease to be a significant energy source by 2002, and possibly as early as 1975.
[42] In 1956, M. King Hubbert used an estimated ultimate recovery (EUR) of 850 trillion cubic feet (24,000 km3) (an amount postulated by geologist Wallace Pratt) to predict a US production peak of about 14 trillion cubic feet (400 km3) per year to occur "approximately 1970".
[43] Pratt, in his EUR estimate (p. 96), explicitly included what he called the "phenomenal discovery rate" that the industry was then experiencing in the offshore Gulf of Mexico.
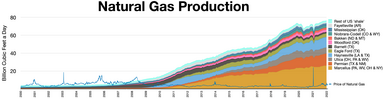
But then instead of declining further, as predicted by the Hubbert curve, natural gas production rose slowly but steadily for the next 15 years, and reached 20.6 TCF in 2001.
The US Energy Information Administration projected that net exports would grow to 4.6 billion cubic feet per day in 2019.
The North American market, consisting of Canada, Mexico, and the United States, all connected by a common pipeline network, has had much lower gas prices in recent years than some other major world gas markets, such as Europe (since 2010), Japan (since 2008), and Korea.
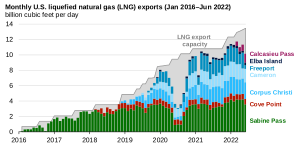
In 2010, after the price of US natural gas fell below that of world markets, US companies have proposed establishing a number of LNG export terminals.
Any proposals to export natural gas must be approved by the US Federal Energy Regulatory Commission (FERC), which gives its approval only if the project receives a satisfactory environmental review, and if FERC finds that the export terminal would be in the public interest.
[52] Cheniere Energy expects to begin exporting LNG through its Sabine Pass terminal in January 2016.
In 2023, exports of liquefied natural gas (LNG) from the United States increased by 12% from the previous year, reaching an average of 13.6 billion cubic feet per day (Bcf/d) in December, and contributing to a record annual total of 20.9 Bcf/d for all natural gas exports.
Additionally, U.S. LNG imports remained minimal, below 0.1 Bcf/d, primarily servicing the New England market during peak demand periods, especially in the winter.


In February 2003 there was a similar spike in natural gas prices because of shortages. [ 15 ]