Optically stimulated luminescence thermochronometry
Optically stimulated luminescence (OSL) thermochronometry is a dating method used to determine the time since quartz[1][2] and/or feldspar[3][4] began to store charge as it cools through the effective closure temperature.
These charges are accommodated within crystallographic defects or vacancies in their crystal lattices as the mineral cools below the closure temperature.
[7] The luminescence or light emission from the mineral is assumed to be proportional to the trapped electron charge population.
[1][8][10][11][12] In natural environment, crystal lattices of quartz and/or feldspar are bombarded with radiation released from radiogenic source[7] such as in -situ radioactive decay.
The charge trapping process involves atomic-scale ionic substitution of both electron and hole within the crystal lattices of quartz and feldspar.
[7] The electron diffusion happens in response to ionizing radiation as the minerals cools below their closure temperature.
[5][13] If quartz or feldspar gains are exposed to natural light source such as the sun, the trapped charges will be evicted in form of luminescence.
Any other process that could heat up the sample will also cause the trapped electrons to escape from the crystal lattice known as thermal bleaching.
[7] A wide range of kinetic models have been developed to explain trapping and detrapping processes in quartz and feldspar crystals.
[9] Sufficient number of T-t paths conducted in the laboratory is used to build a probability density function, which will help to determine the most likely cooling histories undergone by the mineral.
[7] Minerals (quartz and/or feldspar) are usually separated from the rock or sediment samples under regulated laboratory lighting system similar to procedures used in archaeological OSL dating.
[7] Crushing of sample are gently carried out to avoid generating heat that is strong enough to reset OSL signal in the minerals.
The selected grains are chemically treated with HCl to digest carbonates and with H2O2 to remove organic materials[7] that can contaminate the sensitivity of OSL signal during measurement.
[7] Inclusions of zircon, apatite and feldspar in quartz as well as alpha-particles irradiated grain edges that can contaminate OSL signal are removed by etching in hydrofluoric acid (HF).
During this measurement, the mineral grain (quartz or feldspar) is glued on a heater strip (stainless-steel discs) using adhesive (commonly silicone spray).
[7] During this process, they give the OSL signal, which is collected or recorded in the ray sensitive photomultiplier tube.
[6] The dose rate is the effective radiation absorbed from naturally occurring ionizing source per unit time.
) can be determined by measuring the concentrations of uranium, potassium and thorium by direct mass spectrometric analysis of quartz or feldspar grains.
[18] The protocol involves series of laboratory measurement of OSL signal (see Plot A), which is emitted by the aliquot after it has been optically stimulated at a known beta dose within a given time in seconds.
During SAR protocol, the difference in the measurement for quartz and feldspar is mainly on the degree of heat required per time and the source of stimulation.
After preheating, the aliquot is optically stimulated by Infrared light emitting diode (for feldspar) or Blue light emitting diode (for quartz) depending on which mineral (see OSL detection system) for 40 s at 125 °C (for feldspar) or 100 s at 125 °C (for quartz) and the natural OSL signal (NL) is measured and recorded in the photomultiplier tube.
[20] The same procedure as described above is followed but a range of regenerative dose is given at different temperature for sensitivity correction of OSL signal (See Plot B).
The point of interception with the curve represent the equivalent dose by reading its value on the horizontal axis (See Plot B).
These studies are mainly captured within the sub-Quaternary period including, but not limited to focused fluvial and/or glacial erosion, rock exhumation and evolution of topography in active tectonic regions.
[8] In active tectonics regions, the application of OSL dating is very useful in tracking the thermal history and rate of rock exhumation towards the Earth's surface.
[1][8] The closer the cooling ages, the higher the rate of erosion and/or exhumation of the rock unit under investigation.
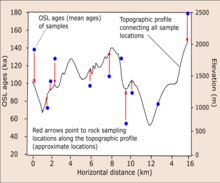
The OSL ages (see diagram), cooling ages, elevation data are plotted against the horizontal distance where samples and elevation data were collected to interpret the exhumation rate of rock or the evolution of the relief system through time.
[1] For example, OSL dating has been applied in determined the cooling histories of some rapidly eroding active regions at sub-Quaternary time-scale (i.e. 104 to 105 years).
These examples are Whataroa-Perth catchment area in the Southern Alps of New Zealand[1] and Namche Barwa-Gyala Peri dome in eastern Himalaya.
[1] In both studies, the rate of exhumation and evolution of the relief systems were estimated by inversion of OSL thermochronological ages.