PET for bone imaging
Positron emission tomography for bone imaging, as an in vivo tracer technique, allows the measurement of the regional concentration of radioactivity proportional to the image pixel values averaged over a region of interest (ROI) in bones.
Positron emission tomography is a functional imaging technique that uses [18F]NaF radiotracer to visualise and quantify regional bone metabolism and blood flow.
[5][7][8][9][10] Many studies have [18F]NaF PET to measure bone metabolism at the hip,[3] lumbar spine, and humerus.
[19] However, it is freely available to the bone surface for uptake because the equilibrium between erythrocytes and plasma is much faster than the capillary transit time.
[20] [18F]NaF is also taken-up by immature erythrocytes in the bone marrow,[21] which plays a role in fluoride kinetics.
[23] [18F]NaF renal clearance is affected by diet[24] and pH level,[25] due to its re-absorption in the nephron, which is mediated by hydrogen fluoride.
[26] However, large differences in urine flow rate[19] are avoided for controlled experiments by keeping patents well hydrated.
[32][33][34] The standardized uptake value (SUV) is defined as tissue concentration (KBq/ml) divided by activity injected normalized for body weight.
The measurement of SUV is easy,[36] cheap, and quicker to perform, making it more attractive for clinical use.
[37][38] SUV can be measured at a single site, or the whole skeleton using a series of static scans and restricted by the small field-of-view of the PET scanner.
[32] The SUV has emerged as a clinically useful, albeit controversial, semi-quantitative tool in PET analysis.
The calculation of rate constants or Ki requires three steps:[3] The method was first described by Cunningham & Jones[46] in 1993 for the analysis of dynamic PET data obtained in the brain.
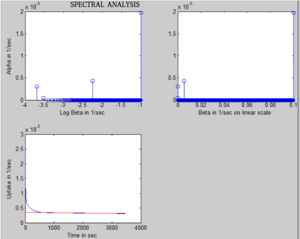
It assumes that the tissue impulse response function (IRF) can be described as a combination of many exponentials.
is a convolution operator, Cbone(t) is the bone tissue activity concentration of tracer (in units: MBq/ml) over a period of time t, Cplasma(t) is the plasma concentration of tracer (in units: MBq/ml) over a period of time t, IRF(t) is equal to the sum of exponentials, β values are fixed between 0.0001 sec−1 and 0.1 sec−1 in intervals of 0.0001, n is the number of α components that resulted from the analysis and β1, β2,..., βn corresponds to the respective α1, α2,..., αn components from the resulted spectrum.
The intercept of the linear fit to the slow component of this exponential curve is considered the plasma clearance (Ki) to the bone mineral.
[48][49][50] This is perhaps the simplest of all the mathematical methods for the calculation of Ki but the one most sensitive to noise present in the data.
is a convolution operator, Cbone(t) is the bone tissue activity concentration of tracer (in units: MBq/ml) over a period of time t, Cplasma(t) is the plasma concentration of tracer (in units: MBq/ml) over a period of time t, and IRF(t) is the impulse response of the system (i.e., a tissue in this case).
Various different versions of this model exist; however, the most fundamental approach is considered here with two tissue compartments and four tracer-exchange parameters.
Hawkins et al. found that the inclusion of an additional parameter called fractional blood volume (BV), representing the vascular tissue spaces within the ROI, improved the data fitting problem, although this improvement was not statistically significant.
where, within the tissue region-of-interest from the PET image, Cbone(T) is the bone tissue activity concentration of tracer (in units: MBq/ml) at any time T, Cplasma(T) is the plasma concentration of tracer (in units: MBq/ml) at time T, Vo is the fraction of the ROI occupied by the ECF compartment, and
[52] The calculation of Ki using arterial input function, time-activity curve, and Hawkins model was limited to a small skeletal region covered by the narrow field-of-view of the PET scanner while acquiring a dynamic scan.
However, Siddique et al.[53] showed in 2012 that it is possible to measure Ki values in bones using static [18F]NaF PET scans.
Blake et al.[32] later showed in 2019 that the Ki obtained using the Siddique–Blake method has precision errors of less than 10%.
However, if Vo is known or fixed, only one single static PET image is required to obtain the second time-point to measure m, representing the Ki value.
This method should be applied with great caution to other clinical areas where these assumptions may not hold true.
The SUV does not take into consideration the tracer delivery to the local region of interest from where the measurements are obtained, therefore, affected by the physiological process consuming [18F]NaF elsewhere in the body.
The difference in the measurement of Ki and SUV in bone tissue using [18F]NaF are explained in more detail by Blake et al.[34] It is critical to note that most of the methods for calculating Ki require dynamic PET scanning over an hour, except, the Siddique–Blake methods.
However, the calculation of SUV requires a single static PET scan performed approximately 45–60 minutes post-tracer injection at any region imaged within the skeleton.
Many researchers have shown a high correlation between SUV and Ki values at various skeletal sites.
[45] Since SUV has not been validated against the histomorphometry, its usefulness in bone studies measuring response to treatment and disease progression is uncertain.