Past sea level
For example, about 10,200 years ago the last land bridge between mainland Europe and Great Britain was submerged, leaving behind a salt marsh.
[3] Observational and modeling studies of mass loss from glaciers and ice caps indicate a contribution to a sea-level rise of 2 to 4 cm over the 20th century.
Each year about 8 mm (0.3 inches) of water from the entire surface of the oceans falls onto the Antarctica and Greenland ice sheets as snowfall.
High-precision gravimetry from satellites in low-noise flight has determined that in 2006, the Greenland and Antarctic ice sheets experienced a combined mass loss of 475 ± 158 Gt/yr, equivalent to 1.3 ± 0.4 mm/yr sea level rise.
[citation needed] As of the early 2000s, the current rise in sea level observed from tide gauges, of about 3.4 mm/yr,[12] is within the estimate range from the combination of factors above,[13] but active research continues in this field.
At times during Earth's long history, the configuration of the continents and sea floor has changed due to plate tectonics.
However, the largest known example of marine flooding was when the Atlantic breached the Strait of Gibraltar at the end of the Messinian Salinity Crisis about 5.2 million years ago.
This restored Mediterranean Sea levels at the sudden end of the period when that basin had dried up, apparently due to geologic forces in the area of the Strait.
Geologists who study the positions of coastal sediment deposits through time have noted dozens of similar basinward shifts of shorelines associated with a later recovery.
This relatively new branch of geological science linking eustatic sea level to sedimentary deposits is called sequence stratigraphy.
At the onset of deglaciation about 19,000 years ago, a brief, at most 500-year long, glacio-eustatic event may have contributed as much as 10 m to sea level with an average rate of about 20 mm/yr.
[17][18] Solid geological evidence, based largely upon analysis of deep cores of coral reefs, exists only for 3 major periods of accelerated sea level rise, called meltwater pulses, during the last deglaciation.
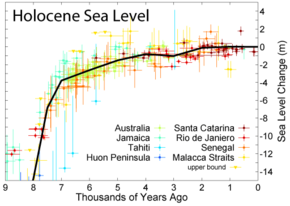
[20] Recently, it has become widely accepted that late Holocene, 3,000 calendar years ago to present, sea level was nearly stable prior to an acceleration of rate of rise that is variously dated between 1850 and 1900 AD.
[17] Since 1880, the ocean began to rise briskly, climbing a total of 210 mm (8.3 in) through 2009 causing extensive erosion worldwide and costing billions.
[24] Baart et al. (2012) show that it is important to account for the effect of the 18.6-year lunar nodal cycle before acceleration in sea level rise should be concluded.