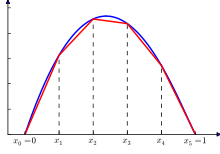
Piecewise linear function
The graph of a continuous piecewise linear function on a compact interval is a polygonal chain.
An algorithm for computing the most significant points subject to a given error tolerance has been published.
However, continuity is not preserved in that case, and also there is no unique reference model underlying the observed data.
[4] If partitions are not known, the residual sum of squares can be used to choose optimal separation points.
[5] However efficient computation and joint estimation of all model parameters (including the breakpoints) may be obtained by an iterative procedure[6] currently implemented in the package segmented[7] for the R language.
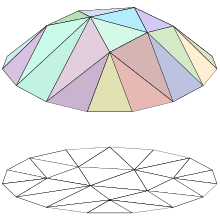
In dimensions higher than one, it is common to require the domain of each piece to be a polygon or polytope.
is convex and continuous, then there is a such that In agriculture piecewise regression analysis of measured data is used to detect the range over which growth factors affect the yield and the range over which the crop is not sensitive to changes in these factors.
The graph on the right reveals that crop yields tolerate a soil salinity up to ECe = 8 dS/m (ECe is the electric conductivity of an extract of a saturated soil sample), while beyond that value the crop production reduces.
The graph is made with the method of partial regression to find the longest range of "no effect", i.e. where the line is horizontal.