Ptychography
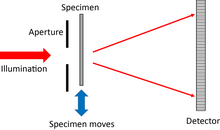
The interference patterns occur some distance away from these two components, so that the scattered waves spread out and "fold" (Ancient Greek: πτύξ is 'fold'[4]) into one another as shown in the figure.
Unlike conventional lens imaging, ptychography is unaffected by lens-induced aberrations or diffraction effects caused by limited numerical aperture.
[5] This is particularly important for atomic-scale wavelength imaging, where it is difficult and expensive to make good-quality lenses with high numerical aperture.
In the case of visible-light biological microscopy, this means that cells do not need to be stained or labelled to create contrast.
Although the interference patterns used in ptychography can only be measured in intensity, the mathematical constraints provided by the translational invariance of the two functions (illumination and object), together with the known shifts between them, means that the phase of the wavefield can be recovered by an inverse computation.
Once this is achieved, all the information relating to the scattered wave (modulus and phase) has been recovered, and so virtually perfect images of the object can be obtained.
There are various strategies for performing this inverse phase-retrieval calculation, including direct Wigner distribution deconvolution (WDD)[6] and iterative methods.
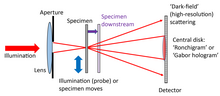
An advantage of the Fresnel regime is that there is no longer a very high-intensity beam at the centre of the diffraction pattern, which can otherwise saturate the detector pixels there.
The specimen is sometimes shifted up or downstream of the probe crossover so as to allow the size of the patch of illumination to be increased, thus requiring fewer diffraction patterns to scan a wide field of view.
Tilting the illumination has the effect of shifting the diffraction pattern across the objective aperture (which also lies in the back focal plane).
[19][20][21] Vectorial ptychography needs to be invoked when the multiplicative model of the interaction between the probe and the specimen cannot be described by scalar quantities.
Jones maps of the specimens can be retrieved, allowing the quantification of a wide range of optical properties (phase, birefringence, orientation of neutral axes, diattenuation, etc.).
Although holography can solve the image phase problem, it is very difficult to implement in the electron microscope, where the reference beam is extremely sensitive to magnetic interference or other sources of instability.
[31] Furthermore, ptychographical data is sufficiently diverse to remove the effects of partial coherence that would otherwise affect the reconstructed image.
[10][11][33] It has sufficient diversity to solve for both the moving functions (illumination and object), which appear symmetrically in the mathematics of the inversion process.
Diversity can also be used to solve retrospectively for errors in the offsets of the two functions, blurring in the scan, detector faults, like missing pixels, etc.
Conversely, ptychography generates estimates of hundreds or thousands of exit waves, each of which contains different scattering information.
It has been used, for example, in the study of nanostructure drug-delivery mechanisms by looking at drug molecules stained by heavy atoms within light carbon nanotubes cages.
[52] The idea required the specimen to be highly ordered (a crystal) and to be illuminated by a precisely engineered wave so that only two pairs of diffraction peaks interfere with one another at a time.
Thibault, also working at the SLS, developed the difference-map (DM) iterative inversion algorithm and mixed-state ptychography.
The group of Margaret Murnane and Henry Kapteyn at JILA, CU Boulder demonstrated EUV reflection ptychographic imaging in 2014.