Seasonality
In time series data, seasonality refers to the trends that occur at specific regular intervals less than a year, such as weekly, monthly, or quarterly.
Seasonality may be caused by various factors, such as weather, vacation, and holidays[1] and consists of periodic, repetitive, and generally regular and predictable patterns in the levels[2] of a time series.
Seasonal fluctuations in a time series can be contrasted with cyclical patterns.
The latter occur when the data exhibits rises and falls that are not of a fixed period.
These regular changes are of less interest to those who study employment data than the variations that occur due to the underlying state of the economy; their focus is on how unemployment in the workforce has changed, despite the impact of the regular seasonal variations.
[3] It is necessary for organisations to identify and measure seasonal variations within their market to help them plan for the future.
This can prepare them for the temporary increases or decreases in labour requirements and inventory as demand for their product or service fluctuates over certain periods.
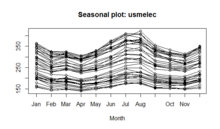
[6] The run sequence plot is a recommended first step for analyzing any time series.
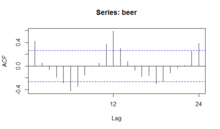
If there is significant seasonality, the autocorrelation plot should show spikes at lags equal to the period.
For example, for monthly data, if there is a seasonality effect, we would expect to see significant peaks at lag 12, 24, 36, and so on (although the intensity may decrease the further out we go).
Semiregular cyclic variations might be dealt with by spectral density estimation.
It is an average that can be used to compare an actual observation relative to what it would be if there were no seasonal variation.
An index value is attached to each period of the time series within a year.
The value 124 indicates that 124 percent of the average quarterly rental occur in winter.
In this method, the original data values in the time-series are expressed as percentages of moving averages.
The deseasonalized time-series data will have only trend (T ), cyclical (C ) and irregular (I ) components and is expressed as: A completely regular cyclic variation in a time series might be dealt with in time series analysis by using a sinusoidal model with one or more sinusoids whose period-lengths may be known or unknown depending on the context.
Another method of modelling periodic seasonality is the use of pairs of Fourier terms.
The difference between a sinusoidal model and a regression with Fourier terms can be simplified as below: Sinusoidal Model: Regression With Fourier Terms: Seasonal adjustment or deseasonalization is any method for removing the seasonal component of a time series.
An appropriate method for seasonal adjustment is chosen on the basis of a particular view taken of the decomposition of time series into components designated with names such as "trend", "cyclic", "seasonal" and "irregular", including how these interact with each other.
Thus, if a seasonal component acts additively, the adjustment method has two stages: If it is a multiplicative model, the magnitude of the seasonal fluctuations will vary with the level, which is more likely to occur with economic series.
; whereby the original time series is divided by the estimated seasonal component.
A cyclic pattern, or simply a cycle, occurs when the data exhibit rises and falls in other periods, i.e., much longer (e.g., decadal) or much shorter (e.g., weekly) than seasonal.
This article incorporates public domain material from NIST/SEMATECH e-Handbook of Statistical Methods.