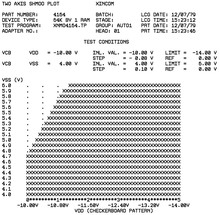
Shmoo plot
These small, blob-like creatures have shapes similar to the "working" volumes that would be enclosed by shmoo plots drawn against three independent variables (such as voltage, temperature, and response speed).
[citation needed] Historically, testing of magnetic core memory arrays produced the "shmoo" shape and the term continued into the semiconductor era.
Shmoo plots are often used to represent the results of the testing of complex electronic systems such as computers or integrated circuits such as DRAMs, ASICs or microprocessors.
For example, when testing semiconductor memory: voltages, temperature, and refresh rates can be varied over specified ranges and only certain combinations of these factors will allow the device to operate.
One example of such “shmooing” is the procedure for optimising the two operating variables of the Read Only Storage (ROS) in the IBM S/360 Model 65 Central Processing Unit (CPU).
To pass the test the shmoo plot must be large enough to contain a rectangle which represents the minimum permissible error-free range of bias voltage and time delay.