Socially optimal firm size
If only diseconomies of scale existed, then the long-run average cost-minimizing firm size would be one worker, producing the minimal possible level of output.
However, economies of scale also apply, which state that large firms can have lower per-unit costs due to buying at bulk discounts (components, insurance, real estate, advertising, etc.)
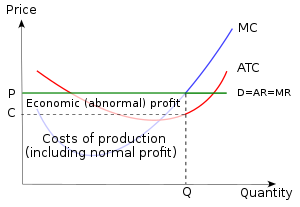
For suppose a particular firm with the illustrated long-run average cost curve is faced with the market price P indicated in the upper graph.
The firm produces at the quantity of output where marginal cost equals marginal revenue (labeled Q in the upper graph), and its per-unit economic profit is the difference between average revenue AR and average total cost ATC at that point, the difference being P minus C in the graph's notation.
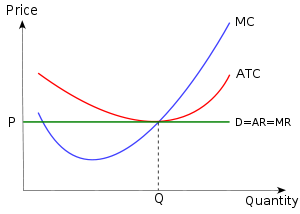
With firms making economic profit and with free entry, other firms will enter the market for this product, and their additional supply will bring down the market price of the product; this process will continue until there is no longer any economic profit to entice further entrants.