Spatial heterogeneity
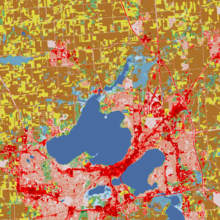
A landscape with spatial heterogeneity has a mix of concentrations of multiple species of plants or animals (biological), or of terrain formations (geological), or environmental characteristics (e.g. rainfall, temperature, wind) filling its area.
[1] Spatial heterogeneity or scaling hierarchy can be measured or quantified by ht-index: a head/tail breaks induced number.
[2][3] Environments with a wide variety of habitats such as different topographies, soil types, and climates are able to accommodate a greater amount of species.
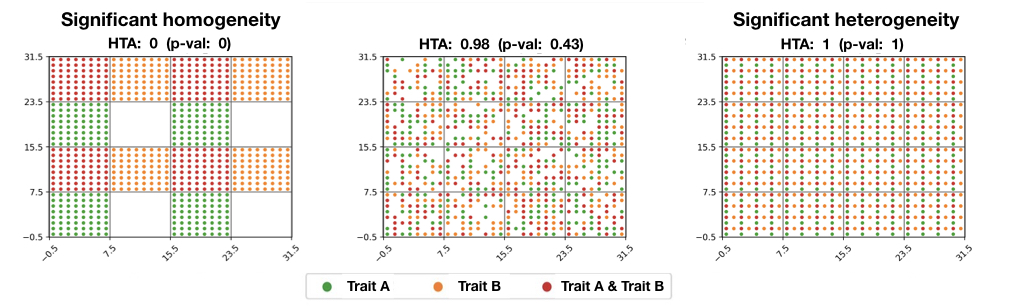
[4] Spatial local heterogeneity can be tested by LISA, Gi and SatScan, while spatial stratified heterogeneity of an attribute can be measured by geographical detector q-statistic:[4] where a population is partitioned into h = 1, ..., L strata; N stands for the size of the population, σ2 stands for variance of the attribute.
:[5] Optimal Parameters-based Geographical Detector (OPGD) characterizes spatial heterogeneity with the optimized parameters of spatial data discretization for identifying geographical factors and interactive impacts of factors, and estimating risks.
[12] The literature cites this paper and states this law as "geographic variables exhibit uncontrolled variance.