Relative species abundance
[1] For example, relative species abundances might describe all terrestrial birds in a forest community or all planktonic copepods in a particular marine environment.
Researchers attempting to understand relative species abundance patterns usually approach them in a descriptive or mechanistic way.
[12] Within the geometric series each species' level of abundance is a sequential, constant proportion (k) of the total number of individuals in the community.
The geometric series rank-abundance diagram is linear with a slope of –k, and reflects a rapid decrease in species abundances by rank (Figure 4).
[13] The geometric series model fits observed species abundances in highly uneven communities with low diversity.
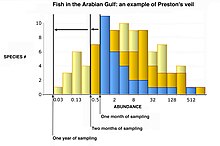
Using several data sets (including breeding bird surveys from New York and Pennsylvania and moth collections from Maine, Alberta and Saskatchewan) Frank W. Preston (1948) argued that species abundances (when binned logarithmically in a Preston plot) follow a normal (Gaussian) distribution, partly as a result of the central limit theorem (Figure 4).
According to his argument, the right-skew observed in species abundance frequency histograms (including those described by Fisher et al. (1943)[14]) was, in fact, a sampling artifact.
As the sample size increases Preston's veil is pushed farther to the left and more of the normal curve becomes visible[2][10](Figure 6).
Williams' moth data, originally used by Fisher to develop the logseries distribution, became increasingly lognormal as more years of sampling were completed.
[9] Thus, a species may survive in the community by carving out a portion of another species' niche (slicing up the pie into smaller pieces) or by moving into a vacant niche (essentially making the pie larger, for example, by being the first to arrive in a newly available location or through the development of a novel trait that allows access previously unavailable resources).
[19] When the value of θ is small, the relative species abundance distribution is similar to the geometric series (high dominance).
As θ gets larger, the distribution becomes increasingly s-shaped (log-normal) and, as it approaches infinity, the curve becomes flat (the community has infinite diversity and species abundances of one).
[1] An unexpected result of the UNTB is that at very large sample sizes, predicted relative species abundance curves describe the metacommunity and become identical to Fisher's logseries.
Thus, the UNTB unintentionally offers a mechanistic explanation of the logseries 50 years after Fisher first developed his descriptive model.