Biological data visualization
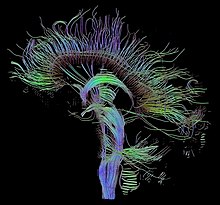
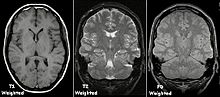
This includes visualization of sequences, genomes, alignments, phylogenies, macromolecular structures, systems biology, microscopy, and magnetic resonance imaging data.
[3][4] Sequence alignment visualization plays a crucial role in bioinformatics and genomics by enabling researchers to interpret and analyze complex genetic data effectively.
[9] To visualize sequence alignments and their features, researchers often rely on popular bioinformatics software tools such as Clustal Omega, MUSCLE, T-Coffee, and MAFFT.
By superimposing aligned sequences onto protein structures, researchers can analyze the spatial arrangement of conserved residues and functional domains.
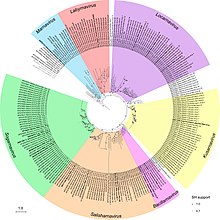
These tools provide interactive displays of phylogenetic trees, highlighting branch lengths, node support values, and evolutionary distances.
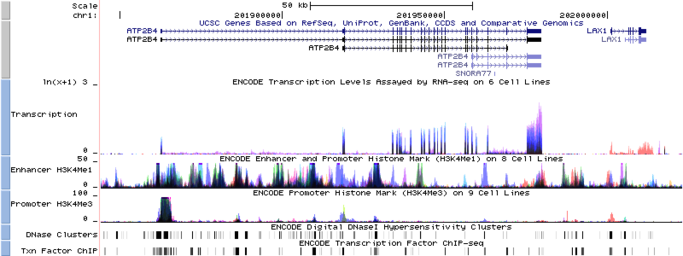
Visualization tools help researchers pinpoint specific variations in genomic sequences and assess their potential impact on phenotypic traits.
These sophisticated visualizations bestow an unprecedented level of clarity and granularity, thereby enhancing our comprehension of the mechanistic underpinnings governing the behavior and interaction of biological entities.
The advent of sophisticated automated segmentation technologies, along with their incorporation into public imaging data repositories, greatly enhances the interpretation process.
AR app also designed to help students visualize and interact with 3D macromolecular structures, addressing the limitations of traditional 2D images in conveying spatial details and depth perception.
Utilizing Unity3D game engine technology, this approach democratizes the creation of interactive molecular visualization tools, resulting in a user-friendly platform that simplifies complex biological data depiction.
[23] High-performance computing visualization enables real-time rendering of massive, intricate datasets, a necessity for advanced macromolecular analysis.
[24] Hybrid visualization techniques merge various methods to provide a multifaceted view of molecules, combining detailed atomic positions with a holistic understanding of structure and volume.
This article details the growth and evolution of the archive with advancing experimental techniques, the critical role of data standards and integration, and the introduction of new tools and features for 3D structural analysis and visualization over the past year.
This method integrates recombinant polymerase amplification (RPA) with a vertical flow visualization strip (VF) to form an RPA-VF assay that targets the thymidine kinase gene, ensuring fast detection, high specificity, and zero cross-reactivity with other pathogens.
[26] Large non-polymeric molecules The visualization of nanoscale materials is crucial for understanding their structure-function relationships, and it typically requires advanced microscopy and analytical techniques that provide high-resolution and high-magnification images.
Due to their small size and high surface area to volume ratio, they exhibit unique chemical and physical properties.
The visualization section on large non-polymeric molecules demonstrates a comprehensive and clear description of the techniques used to study nanoscale materials.
It accurately details the application of advanced microscopy methods like TEM, SEM, AFM, and XRD, along with their relevance to specific nanomaterials such as mesoporous silica nanoparticles, nanocomposites, carbon nanotubes, and nanofibers.
While the section is informative and technically detailed, it could be enhanced by including specific examples of visualization outcomes, discussing the limitations of current techniques, and perhaps introducing emerging methods to provide a more rounded view of the field.
[29] Computational docking plays a vital role in structural biology, with software providing a user-friendly web platform for modeling various macromolecular interactions, such as flexible complexes and membrane-associated assemblies.
[30] Tools PyMOL, Chimera, ChimeraX, Jmol, VMD, Swiss-PdbViewer, Coot, Biovia Discovery Studio, LightDock and Schrodinger's Maestro are key tools in molecular visualization, each offering unique capabilities ranging from high-quality 3D imaging and interactive analysis to support for virtual reality and large-scale simulations, catering to diverse needs in molecular modeling, publication, and education across both open-source and commercial platforms.
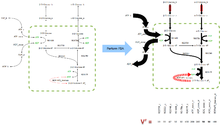
Popular computational models used in systems biology include process calculi, such as stochastic π-calculus, and constraint-based reconstruction and analysis (COBRA), a paradigm that considers physical, enzymatic, and topological constraints underlying a phenotype in a metabolic network.
Alternative mathematical modeling solutions also exist; for instance, a COBRA method such as flux balance analysis could be used to analyze the flow of metabolites through a particular metabolic network.
[34] Another key imaging method in systems biology is mass spectrometry, which can be used to visualize the spatial distribution of compounds, biomarkers, metabolites, peptides, and/or proteins within the body.
Other than optical and electron microscopy, other techniques like scanning probe, ultraviolet, infrared, digital holographic, laser, and amateur are also utilize on Visualization.
[36] Researchers used bright-field light microscopy with high-intensity pulsing LED illumination to capture detailed 12-bit-per-channel images of live cells, addressing data distortions caused by optical path interactions and sensor anomalies with a comprehensive spectroscopic calibration approach, allowing for visualization with minimal information loss in 8-bit intensity depth.
[45] When the magnetic field is removed, the hydrogen protons return to their equilibrium states in a process known as relaxation, and in doing so they emit RF energy.
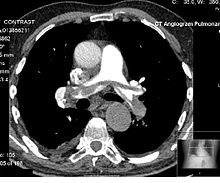
Meanwhile, negative agents such as carbon dioxide gas allow X-rays to pass through them easily, causing the tissues containing them to appear darker.
This is relevant, for instance, in the process of multiple sequence alignment of mitochondrial DNA, viroid, viral or other genomes, which have a circular molecular structure.
The distance between merged clusters is monotone, increasing with the level of the merger: the height of each node in the plot is proportional to the value of the intergroup dissimilarity between its two branches.


