Spectroradiometry for Earth and planetary remote sensing

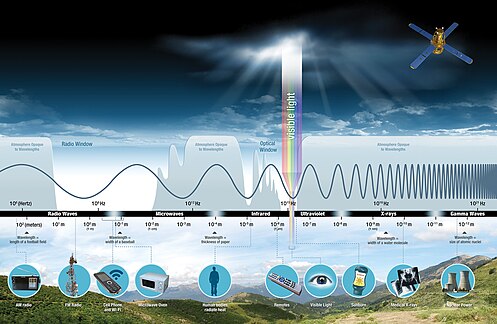
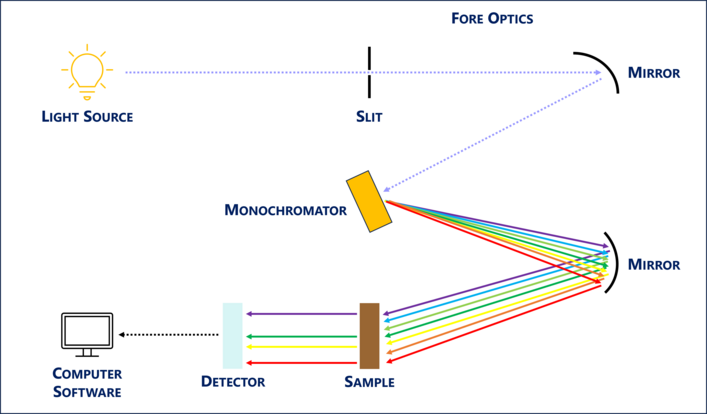
[2] Combining the elements of spectroscopy and radiometry, spectroradiometry carries out precise measurements of electromagnetic radiation and associated parameters within different wavelength ranges.

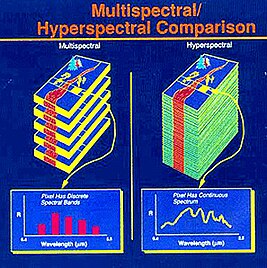
[3] This technique forms the basis of multi- and hyperspectral imaging and reflectance spectroscopy, commonly applied across numerous geoscience disciplines, which evaluates the spectral properties exhibited by various materials found on Earth and planetary bodies.

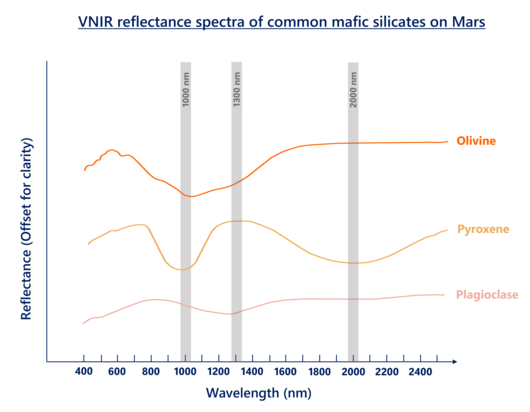
[1] This variation is contributed by the presence of spectrally active components within the material, such as metallic oxides and clay minerals, which give rise to unique absorption features.

The specific shapes associated with the bands that occur at distinctive wavelength positions enable the identification of minerals and facilitate lithological interpretations.

[5] Spectroradiometry offers a simple, non-destructive, rapid, and efficient approach that complements traditional and heavy-duty geochemical methods, to characterize mineral assemblages and rock textures.

[6] Earth Sciences Portal Geology Remote Sensing In spectroradiometry, spectral features can be recognized and quantified by making use of the spectra containing different parameters measured by spectroradiometers.

Although some prominent patterns of absorption may be identified, they are prone to influence from the overall spectra trends, and features like amplitudes and magnitudes could mislead the interpretations under such circumstances.

[12] In order to facilitate data analysis, the raw reflectance spectra are commonly normalized to provide better visualization and quantification of trends and patterns of spectral parameters.

[8] These absorption features arise from the distinct electronic and vibrational processes associated with the energy, molecular components, and internal structures of minerals.

The drying process should be conducted at a temperature of 105 °C or below, which can ensure the removal of adsorbed water without causing any disruption to the internal structures of minerals.

[18][20] Considering the identification capabilities of spectroradiometry for different minerals and rocks, the comprehensive databases that encompass spectral signatures are crucial.

[16] These spectral libraries serve as essential references for ongoing research on spectroradiometry, providing a solid foundation for data analysis and interpretation.

[18][19] The third group of parameters concerns the effects of absorption contributed by Al-OH bonds in clay minerals including illite and kaolinite, which is situated near 2200 nm.

[16] These absorption bands become more asymmetric (AS2200 > 1, showing leftward asymmetry) with increasing kaolinite contents as a result of transformation from illite, implying greater extents of mineral alteration, degree of hydrolysis, and silicate decomposition, which serves as signals that indicate more advanced weathering stages.

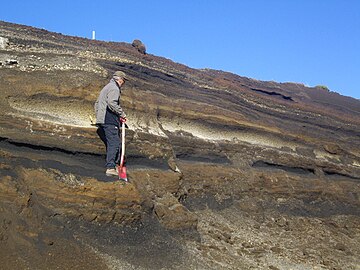
[10] In contrast, mafic ashes, which have low silica content, exhibit lower reflectance due to their purity compared to the mixed compositions of the background sediments.

[24] Additionally, phyllosilicate minerals in volcanic ashes display strong absorption features near 2200 nm, attributed to the stretching of hydroxyl groups (-OH bonds) with aluminium.

[25][27] Meanwhile, non-imaging spectroradiometry, combined with field scanning and sampling, is suitable for localized applications, providing age implications and constraints for stratigraphic units.

[16][8] Using multi-, hyperspectral, and thermal imaging, the ages of surfaces of regional sediment deposits, such as alluvial fans, can be predicted and mapped.

Spectroradiometry, with its ability to identify Earth materials through capturing their distinctive spectral signals, holds significant potential in exploring and predicting the presence of ore deposits and hydrocarbon reservoirs.

[3] These alteration processes are often related to volcanic and geothermal activities, where hot hydrothermal fluids penetrate through fractures in pre-existing country rocks, resulting in the deposition of valuable metallic ores such as gold and copper.

[9][30] The intense weathering processes occurring in granitic rocks give rise to the denudation and leaching of major element oxides, leaving behind the highly decomposed regolith.

[9][30] Throughout the weathering process, clay minerals such as kaolinite and halloysite are generated as alteration products, which possess a strong affinity for adsorbing REEs, leading to their enrichment in the regolith.

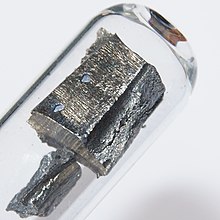
[13][32] Making use of these spectral characteristics, combined with geochemical interpretations and machine learning, the identification and mapping of Nd-enriched regolith areas can be fostered, which may provide implications towards potential REE mineralization and respective ore bodies.

Similarly, the same approach can be used towards the identification of coal reservoirs through their associated coal-bearing rocks, based on the unique spectral imprints given by hydrocarbons, which spans the infrared wavelength regions.

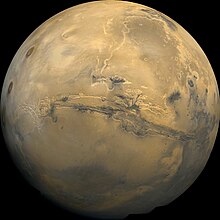
[34] Spectroradiometry, with its ability to characterize surficial compositions and study the geology of these celestial bodies, is considered a key technique in planetary science.

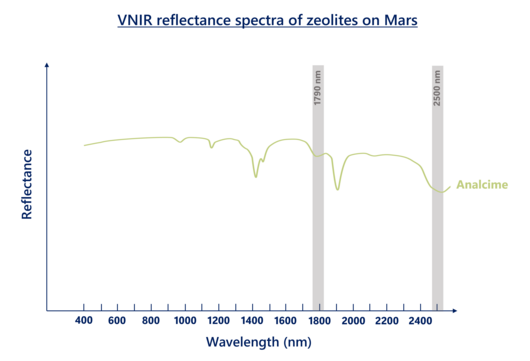
Characterized by their paired absorption features near 2300 and 2500 nm, they are found along Nili Fossae, and Tyrrhena Terra located at the southern Martian highlands.

[34][35] This reflects the increasing of weathering intensity and the occurrence of aqueous processes on Martian crust, indicating that a wet and warm climate had once existed on the planet.

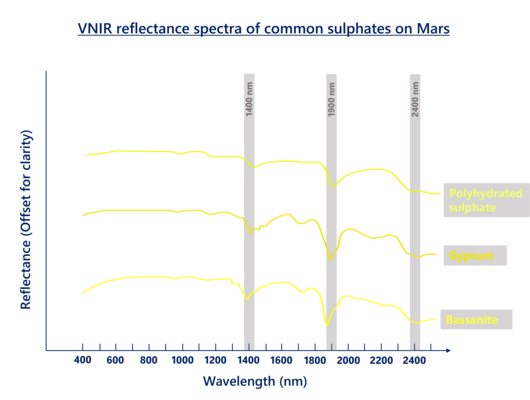
Sulphates commonly form as a result of the alteration of crustal materials by groundwater and rain, and the precipitation of evaporated water bodies.

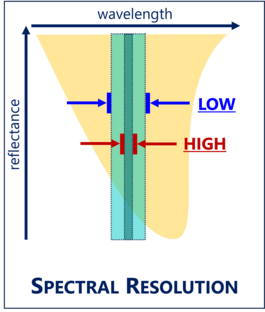
[1][11] Spectral resolution concerns the capability of a sensor in a spectroradiometer to measure the light intensity according to specific wavelengths on the electromagnetic spectrum.

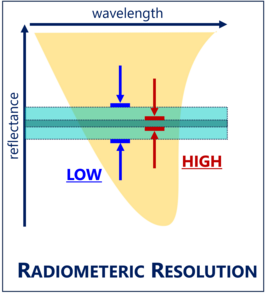
It describes the extent of spatial detail the sensors can record, i.e., the smallest feature detected, based on pixel and grid sizes of the captured digital imagery.

A visualization of different wavelength intervals in the electromagnetic (light) spectrum . Each category of wavelength intervals enables the identification and characterization of substances through their unique spectral features, patterns, and signatures.
A comparison of a reflectance spectra for a given material before and after the continuum removal process, modified from Tan et al., 2021. [ 13 ] The overall shape, level changes, and slopes are eliminated in the continuum removed spectrum with reference to the continuum lines, which further enhances the clarity of individual absorption features in the reflectance spectrum.
An illustration of geometrical parameters in the visible-near Infrared (VNIR) reflectance spectrum of montmorillonite, a clay mineral . Modified from Clark et al., 2007. [ 15 ] The analysis of absorption features in a reflectance spectrum typically looks into the position (P) , depth (D) , and width (W) of absorption bands across a certain wavelength interval. The full width at half maximum (F) and asymmetry (AS) of shape with respect to the absorption bands are also commonly evaluated. Together, these elements combine to build spectral indices in order to characterize and parameterize specific minerals .
The reflectance spectra of common clay minerals ( phyllosilicates ) in the visible and near infrared (VNIR) region, modified from Clark et al., 2007. [ 15 ] The values of reflectance as shown in the figure were offset to allow for clear comparison of spectral features among the minerals. Diagnostic absorption peaks exhibited by different clay minerals are observed along 1400, 1900, 2200, and 2300 nm, which can be used to distinguish from one another.
The reflectance spectra of common iron oxides in the visible and near infrared (VNIR) region, modified from Clark et al., 2007. [ 15 ] The values of reflectance as shown in the figure were offset to facilitate comparison of spectral features among the two minerals. Diagnostic absorption peaks exhibited by hematite and goethite are observed along 500, 700, and 920 nm, which can be used to distinguish from one another.
Tephra horizons as shown in an outcrop at Iceland . Tephra stands out from background sediments with its high albedo and reflectance values, which can be detected using spectroradiometry. Spectroradiometry is particularly useful in identifying tephra layers when the colour and appearance of sediments look similar, and when the tephra layers are heavily mixed with background sediments. For instance, only one tephra layer is observed in the outcrop shown in the figure. There might be more tephra layers hidden within the strata that could be detected only by using a spectroradiometer .
A sample of Neodymium , commonly found in Regolith-hosted rare earth element deposits . It holds substantial economic value. Notably, neodymium exhibits unique spectral characteristics that make it highly traceable using spectroradiometry.
The visible and near infrared (VNIR) reflectance spectra of common ices on Mars, modified from Viviano et al., 2014. [ 36 ] The values of reflectance as shown in the figure were offset to facilitate comparison of spectral features among the two ices. Diagnostic absorption peaks exhibited by crystalline H 2 O and CO 2 ices are observed along 1435, 1500, and 2280 nm.
The visible and near infrared (VNIR) reflectance spectra of common mafic silicates on Mars, modified from Viviano et al., 2014. [ 36 ] The values of reflectance as shown in the figure were offset to facilitate comparison of spectral features among the three minerals. Diagnostic absorption peaks exhibited by olivine , pyroxene , and plagioclase are observed along 1100, 1300, and 2000 nm.
The visible and near infrared (VNIR) reflectance spectra of common ices on Mars, modified from Viviano et al., 2014. [ 36 ] The values of reflectance as shown in the figure were offset to facilitate comparison of spectral features among the three minerals. Diagnostic absorption peaks exhibited by talc , prehnite , and serpentine are observed along 1400 to 1500, and 2300 to 2500 nm.
Valles Marineris, a snapshot taken by the Viking 1 probe. Polyhydrated sulphates are abundant along this area.
The visible and near infrared (VNIR) reflectance spectra of common sulphates on Mars, modified from Viviano et al., 2014. [ 36 ] The values of reflectance as shown in the figure were offset to facilitate comparison of spectral features among the three minerals. Diagnostic absorption peaks exhibited by polyhydrated sulphates , including gypsum and bassanite , are observed along 1400, 1900, and 2400 nm.
The visible and near infrared (VNIR) reflectance spectra of common ices on Mars, modified from Viviano et al., 2014. [ 36 ] Diagnostic absorption peaks exhibited by analcime are observed along 1790 and 2500 nm.
The visible and near infrared (VNIR) reflectance spectra of common ices on Mars, modified from Viviano et al., 2014. [ 36 ] Diagnostic absorption peaks exhibited by iron -rich carbonates are observed along 2300 and 2500 nm.
A schematic diagram showing the basic components of a spectroradiometer and how it works.
A schematic diagram showing the basic components of a spectroradiometer and how it works. The spectroradiometer first captures light from the target substance being measured. The components of fore optics such as optical lenses , diffusers , filters , and slits ensure the source radiation is delivered onto the detectors appropriately and efficiently. The collected light then passes through a monochromator , where it is separated into different ranges of wavelengths to create a spectrum. The separated wavelengths of light are subsequently directed onto a detector, such as a charge-coupled device (CCD) array or a CMOS sensor , where the radiation intensities across the spectrum are recorded. The measurements of the detector is finally converted into a digital format to obtain the spectral data through computer software. [ 39 ]
The monochromator , as a standard component of a spectroradiometer , is key to create a wide spectrum that exhibits the spectral properties of substances. It utilizes a dispersive element, such as a prism or diffraction grating, to split light radiation collected from substances into different ranges of wavelengths .
A visualization of spectral resolution . The area bounded by the curve represents the magnitude of electromagnetic radiation reflected by a given material at various wavelengths . Devices with high spectral resolution can measure the reflectance for the material within narrow bands of wavelength .
A figure illustrating the differences between multi- and hyperspectral imaging . A hyperspectral sensor collects spectral data in a continuous spectrum whereas a multispectral sensor collects spectral data in varying bandwidths in the EM spectrum .
A visualization of spatial resolution , which refers to the level of detail or the smallest discernible features that can be captured by a given spectroradiometer .
A visualization of radiometric resolution . The area bounded by the curve represents the magnitude of electromagnetic radiation reflected by a given material at various wavelengths . Devices with high radiometric resolution can precisely measure and detect relatively small differences in the values of reflectance for a given material.