Spectrum analyzer
This form factor is useful for applications where the spectrum analyzer can be plugged into AC power, which generally means in a lab environment or production/manufacturing area.
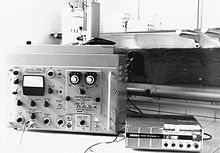
Bench top spectrum analyzers have historically offered better performance and specifications than the portable or handheld form factor.
Bench top spectrum analyzers normally have multiple fans (with associated vents) to dissipate heat produced by the processor.
Due to their architecture, bench top spectrum analyzers typically weigh more than 30 pounds (14 kg).
Some bench top spectrum analyzers offer optional battery packs, allowing them to be used away from AC power.
This form factor is useful for any applications where the spectrum analyzer needs to be taken outside to make measurements or simply carried while in use.
While many spectrum analyzers have an Ethernet port for control, they typically lack efficient data transfer mechanisms and are too bulky or expensive to be deployed in such a distributed manner.
Key applications for such devices include RF intrusion detection systems for secure facilities where wireless signaling is prohibited.
This can place considerable demands on the required analog-to-digital converter and processing power for the Fourier transform, making FFT based spectrum analyzers limited in frequency range.
This method is made possible by first down converting the signal, then digitizing the intermediate frequency and using superheterodyne or FFT techniques to acquire the spectrum.
Also, for consideration of narrow spans, the FFT can be used to increase sweep time without distorting the displayed spectrum.
FFT's are processed in parallel, gapless and overlapped so there are no gaps in the calculated RF spectrum and no information is missed.
The FFT process applies windowing techniques to improve the output spectrum due to producing less side lobes.
A normal swept spectrum analyzer would produce max peak, min peak displays for example but a realtime spectrum analyzer is able to plot all calculated FFT's over a given period of time with the added colour-coding which represents how often a signal appears.
These two parameters allow for adjustment of the display within the frequency range of the instrument to enhance visibility of the spectrum measured.
[7] It determines the RF noise floor and how close two signals can be and still be resolved by the analyzer into two separate peaks.
[7] Adjusting the bandwidth of this filter allows for the discrimination of signals with closely spaced frequency components, while also changing the measured noise floor.
Detectors are used in an attempt to adequately map the correct signal power to the appropriate frequency point on the display.
[9] Spectrum analyzers are widely used to measure the frequency response, noise and distortion characteristics of all kinds of radio-frequency (RF) circuitry, by comparing the input and output spectra.
For example, in RF mixers, spectrum analyzer is used to find the levels of third order inter-modulation products and conversion loss.
A spectrum analyzer is used to determine whether a wireless transmitter is working according to defined standards for purity of emissions.
A spectrum analyzer interface is a device that connects to a wireless receiver or a personal computer to allow visual detection and analysis of electromagnetic signals over a defined band of frequencies.
Analysis can be carried out by a general-purpose digital computer with a sound card selected for suitable performance[11] and appropriate software.
Instead of using a low-distortion sinewave, the input can be subtracted from the output, attenuated and phase-corrected, to give only the added distortion and noise, which can be analysed.
In these applications, the spectrum analyzer will show volume levels of frequency bands across the typical range of human hearing, rather than displaying a wave.
An electro-optical detector is used to measure the intensity of the light, which is then normally displayed on a screen in a similar manner to a radio- or audio-frequency spectrum analyzer.
As the grating in the monochromator moves, bands of different frequencies (colors) are 'seen' by the detector, and the resulting signal can then be plotted on a display.
More precise measurements (down to MHz in the optical spectrum) can be made with a scanning Fabry–Pérot interferometer along with analog or digital control electronics, which sweep the resonant frequency of an optically resonant cavity using a voltage ramp to piezoelectric motor that varies the distance between two highly reflective mirrors.
A sensitive photodiode embedded in the cavity provides an intensity signal, which is plotted against the ramp voltage to produce a visual representation of the optical power spectrum.