Streamgraph
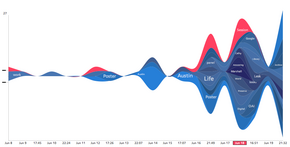
A streamgraph, or stream graph, is a type of stacked area graph which is displaced around a central axis, resulting in a flowing, organic shape.
Unlike a traditional stacked area graph in which the layers are stacked on top of an axis, in a streamgraph the layers are positioned to minimize their "wiggle".
[2] Streamgraphs and their use were popularized by Amanda Cox in a February 2008 New York Times article on movie box office revenues.
[3] Cox got the idea from then-undergraduate Lee Byron,[1] who had used a similar method for visualizing his music listening history.
[1] Streamgraphs were found to be more readable than basic stacked area graphs or ThemeRivers for value comparison tasks.