Structure chart
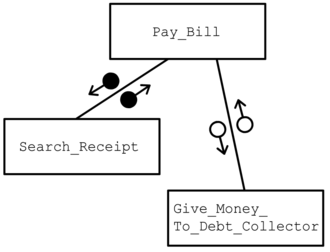
[3] A structure chart is a top-down modular design tool, constructed of squares representing the different modules in the system, and lines that connect them.
The lines represent the connection and or ownership between activities and subactivities as they are used in organization charts.
During the actual building of the program (implementation), the chart is continually referred to as "the master-plan".
The representation must describe the breakdown of the configuration system into subsystems and the lowest manageable level.
During the configuration control process, the structure chart is used to identify CIs and their associated artifacts that a proposed change may impact.