System dynamics
[1] System dynamics is a methodology and mathematical modeling technique to frame, understand, and discuss complex issues and problems.
Originally developed in the 1950s to help corporate managers improve their understanding of industrial processes, SD is currently being used throughout the public and private sector for policy analysis and design.
Forrester's insights into the common foundations that underlie engineering, which led to the creation of system dynamics, were triggered, to a large degree, by his involvement with managers at General Electric (GE) during the mid-1950s.
At that time, the managers at GE were perplexed because employment at their appliance plants in Kentucky exhibited a significant three-year cycle.
Richard Bennett created the first system dynamics computer modeling language called SIMPLE (Simulation of Industrial Management Problems with Lots of Equations) in the spring of 1958.
[2] In 1967, Richard M. Goodwin published the first edition of his paper "A Growth Cycle",[4] which was the first attempt to apply the principles of system dynamics to economics.
The Club of Rome is an organization devoted to solving what its members describe as the "predicament of mankind"—that is, the global crisis that may appear sometime in the future, due to the demands being placed on the Earth's carrying capacity (its sources of renewable and nonrenewable resources and its sinks for the disposal of pollutants) by the world's exponentially growing population.
Upon his return to the United States, Forrester refined WORLD1 in preparation for a visit to MIT by members of the Club of Rome.
[2] The primary elements of system dynamics diagrams are feedback, accumulation of flows into stocks and time delays.
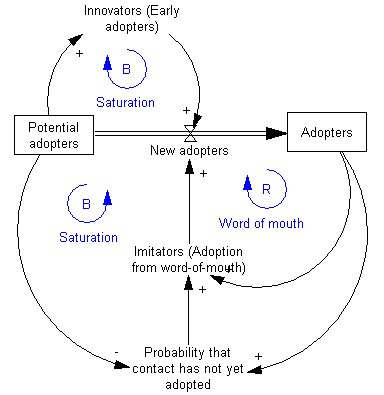
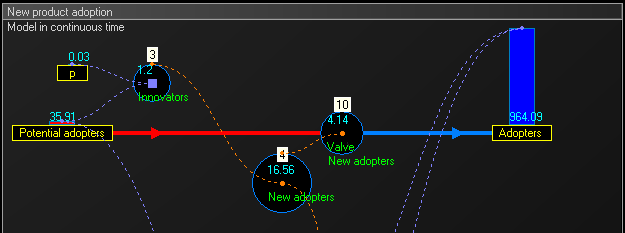
As an illustration of the use of system dynamics, imagine an organisation that plans to introduce an innovative new durable consumer product.
However, in general a causal loop diagram does not specify the structure of a system sufficiently to permit determination of its behavior from the visual representation alone.
The steps involved in a simulation are: In this example, the equations that change the two stocks via the flow are: List of all the equations in discrete time, in their order of execution in each year, for years 1 to 15 : The dynamic simulation results show that the behaviour of the system would be to have growth in adopters that follows a classic s-curve shape.
They are a potent tool to: Computer software is used to simulate a system dynamics model of the situation being studied.
Running "what if" simulations to test certain policies on such a model can greatly aid in understanding how the system changes over time.
[14] This has been used to successfully model world economic behaviour from the apparent stability of the Great Moderation to the sudden unexpected Financial crisis of 2007–08.
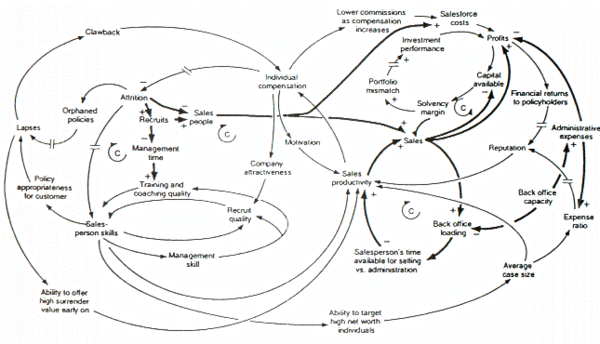
The figure above is a causal loop diagram of a system dynamics model created to examine forces that may be responsible for the growth or decline of life insurance companies in the United Kingdom.
Last, it is clear that a decision maker would find it impossible to think through the dynamic behavior inherent in the model, from inspection of the figure alone.