Tent map
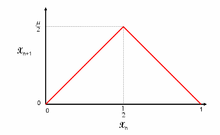
In mathematics, the tent map with parameter μ is the real-valued function fμ defined by the name being due to the tent-like shape of the graph of fμ.
For the values of the parameter μ within 0 and 2, fμ maps the unit interval [0, 1] into itself, thus defining a discrete-time dynamical system on it (equivalently, a recurrence relation).
: where μ is a positive real constant.
Choosing for instance the parameter μ = 2, the effect of the function fμ may be viewed as the result of the operation of folding the unit interval in two, then stretching the resulting interval [0, 1/2] to get again the interval [0, 1].
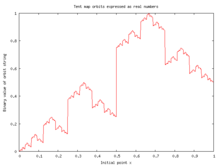
Iterating the procedure, any point x0 of the interval assumes new subsequent positions as described above, generating a sequence xn in [0, 1].
Depending on the value of μ, the tent map demonstrates a range of dynamical behaviour ranging from predictable to chaotic.
The asymmetric tent map is essentially a distorted, but still piecewise linear, version of the
} will have the same autocorrelation function[3] as will data from the first-order autoregressive process
Thus data from an asymmetric tent map cannot be distinguished, using the autocorrelation function, from data generated by a first-order autoregressive process.
The tent map has found applications in social cognitive optimization,[4] chaos in economics,[5][6] image encryption,[7] on risk and market sentiments for pricing,[8] etc.