The Product Space
The network first appeared in the July 2007 issue of Science in the article "The Product Space Conditions the Development of Nations,"[1] written by Cesar A. Hidalgo, Bailey Klinger, Ricardo Hausmann, and Albert-László Barabási.
[2] From the new analytic tools developed, Hausmann, Hidalgo and their team have been able to elaborate predictions of future economic growth.
[3][4][5] Traditional ideals suggest that industrialization causes a “spillover” effect to new products, fostering subsequent growth.
[7] These theories fail to capture inherent commonalities among products, which undoubtedly contribute to a country's pattern of growth.
To do this, the monkeys must jump distances; that is, redeploy (physical, human, and institutional) capital to make new products.
Traditional economic theory disregards the structure of the forest, assuming that there is always a tree within reach.
Choosing to study one of these notions assume the others are relatively unimportant; instead, the Product Space considers an outcome-based measure built on the idea that if a pair of products are related because they require similar institutions, capital, infrastructure, technology, etc., they are likely to be produced in tandem.
Proximity formalizes the intuitive idea that a country's ability to produce a product depends on its ability to produce other products: a country which exports apples most probably has conditions suitable for exporting pears: the country would already have the soil, climate, packing equipment, refrigerated trucks, agronomists, phytosanitary laws, and working trade agreements.
These inputs would be futile, however, if the country instead chose to start producing a dissimilar product such as copper wire or home appliances.
Using the Balassa[8] definition of RCA, x(c,i) equals the value of exports in country c in the ith good.
The Product Space uses international trade data from Feenstra, Lipset, Deng, Ma, and Mo's World Trade Flows: 1962-2000 dataset,[9] cleaned and made compatible through a National Bureau of Economic Research (NBER) project.
A network representation of the proximity matrix helps to develop intuition about its structure by establishing a visualization in which traditionally subtle trends become easily identifiable.
With the framework complete, a force-directed spring algorithm was used to achieve a more ideal network layout.
This algorithm considers each node to be a charged particle and the links are assumed to be springs; the layout is the resulting equilibrium, or relaxed, position of the system.
Manual rearranging untangled dense clusters to achieve maximum aesthetic efficacy.
In the final Product Space visualization, it is clear that the network exhibits heterogeneity and a core-periphery structure: the core of the network consists of metal products, machinery, and chemicals, whereas the periphery is formed by fishing, tropical, and cereal agriculture.
On the left side of the network, there is a strong outlying cluster formed by garments and another belonging to textiles.
At the bottom of the network, there exists a large electronics cluster, and at its right mining, forest, and paper products.
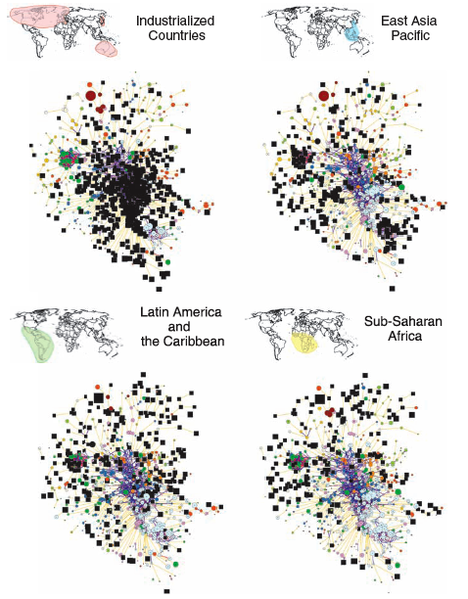
A country's orientation within the space can be determined by observing where its products with RCA>1 are located.
The images at right reveal patterns of specialization: the black squares indicate products exported by each region with RCA>1.
Latin America and the Caribbean have specialized in industries further towards the periphery, such as mining, agriculture, and garments.
From these analyses, it is clear that each region displays a recognizable pattern of specialization easily discernible in the product space.
"[13] Additionally, it would be interesting to explore the mechanisms governing countries' economic growth, in terms of acquisition of new capital, labor, institutions, etc., and whether the co-export proximity of the Product Space is truly an accurate reflection of similarity among such inputs.