The season officially started on May 15 in the Eastern Pacific—east of 140°W—and on June 1 in the Central Pacific—between the International Date Line and 140°W—and ended on November 30.
[nb 1] Activity in the Central Pacific shattered records, with 16 tropical cyclones forming in or entering the basin; the previous highest was 11 during the 1992 and 1994 seasons.
[4] On August 30, three hurricanes at Category 4 strength—Ignacio, Jimena, and Kilo—existed simultaneously in the Northeastern Pacific, which was a first for the basin.
Activity in the basin was boosted by the strong 2014–16 El Niño event, which brought anomalously high sea surface temperatures and low vertical wind shear that helped the numerous systems form and intensify.
This timeline documents tropical cyclone formations, strengthening, weakening, landfalls, extratropical transitions, and dissipations during the season.
Hurricane Andres shortly after peak intensity on June 1
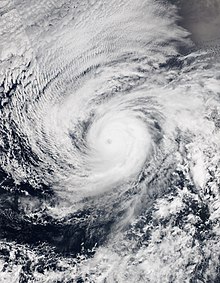
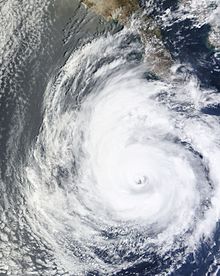
Hurricane Blanca near peak intensity on June 3
Tropical Depression Blanca weakening over the Baja California Peninsula on June 8
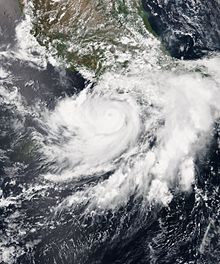
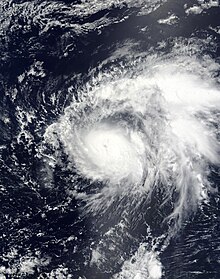
Hurricane Carlos at peak intensity on June 13
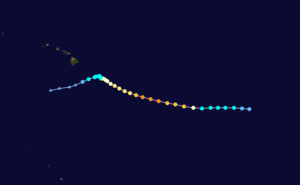
Tracks of Tropical Storms Halola
(left)
, Iune
(center)
, and Ela
(right)
across the Central Pacific basin during July; the
Hawaiian islands
are shown in the middle of the map.
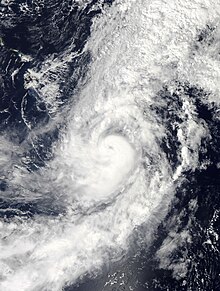
Path of Tropical Storm Enrique in the open Pacific Ocean
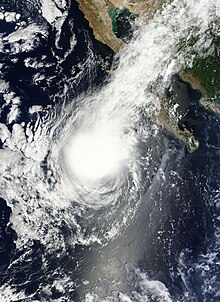
A weakening Hurricane Dolores southwest of the Baja California Peninsula on July 16
Hurricane Guillermo at peak strength on July 31
Path of Hurricane Hilda across the Central Pacific. Briefly threatening the Hawaiian Islands, Hilda eventually weakened and turned away on August 12.
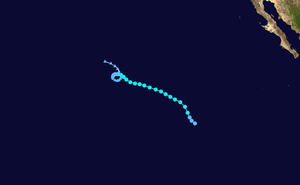
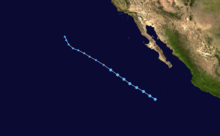
Path of Tropical Depression Eleven-E paralleling the west coast of Mexico
Hurricane Loke
(top)
and Tropical Depression Kilo
(bottom)
on August 25
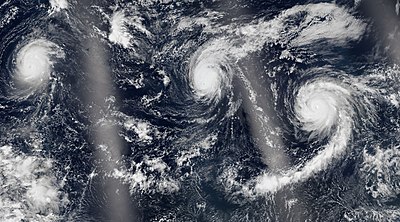
Hurricanes Kilo
(left)
, Ignacio
(center)
, and Jimena
(right)
at major hurricane strength on August 30. This was the first time that three such systems existed simultaneously over the Pacific Ocean east of the International Date Line since reliable records began.
[
5
]
Tropical Storm Kevin holding its intensity on September 4
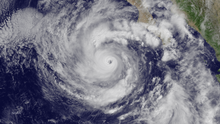
Hurricane Linda at Category 3 strength on September 8
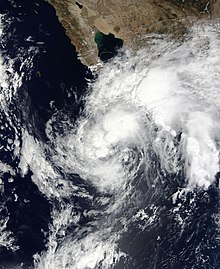
The nascent Tropical Depression Sixteen-E on September 20. The system's
rainbands
already cover Baja California Sur and extend into the
Gulf of California
.
Tropical Storm Niala shortly after being named on September 25
Hurricane Oho intensifying on October 6. The
trough
that steered the system northeast can be seen north of the hurricane.
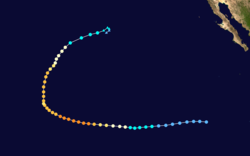
Storm path of Hurricane Olaf, which traversed the Eastern and Central Pacific basins from October 15–27.
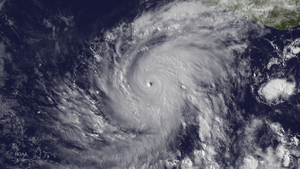
Hurricane Patricia approaching Western Mexico at Category 5 strength on October 23. Just minutes after this picture was taken,
hurricane hunters
observed the Western Hemisphere then-record-low pressure of 879 mbar (hPa; 25.96 inHg), but post-storm analysis concluded that the peak intensity had occurred several hours earlier.