Timeline of the 2015 Atlantic hurricane season
[nb 2] While no hurricanes made landfall on the United States mainland during the year, two tropical storms, Ana and Bill, struck the coastline of South Carolina and Texas respectively.
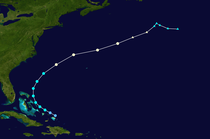
Additionally, Joaquin was responsible sinking of the American cargo ship El Faro and for the deaths of its 33–member crew.
Following the 2015 season, the names Erika and Joaquin were retired from reuse in the North Atlantic by the World Meteorological Organization.
[4][5] This timeline documents tropical cyclone formations, strengthening, weakening, landfalls, extratropical transitions, and dissipations during the season.
Additionally, figures for maximum sustained winds and position estimates are rounded to the nearest 5 units (knots, miles, or kilometers), following the convention used in the National Hurricane Center's products.