Timeline of the 2019 Pacific typhoon season

[3] Activity in the 2019 season was greater than normal,[nb 1] primarily due to high sea surface temperatures.

[4] The conditions became neutral during the northern summer, as strong activity occurred in the monsoon trough over Southeast Asia in August, promoting tropical cyclogenesis.

[11] Typhoon Bualoi exacerbated the effects of Faxai and Hagibis, producing floods that caused damages of US$200 million and killed 13, despite not reaching land.

[12][13] The last two named storms, typhoons Kammuri and Phanfone, each made landfalls over the Philippines in December, causing ₱11.027 billion (US$212.910 million) of damages and 74 deaths combined.

It documents tropical cyclone formations, strengthening, weakening, landfalls, extratropical transition, and dissipations during the season.

A photograph of a tropical storm near the Malay Peninsula. Although most of the cloudiness and thunderstorms associated with the system are amorphous and disorganized, it is exhibiting healthy outflow on its western flank, as indicated by a large number of thin, relatively straight, cirrus clouds pointing outward from the western half of its circulation.
Satellite image of Tropical Storm Pabuk at its peak intensity and approaching Thailand on January 4
A track map showing the erratic, but generally westward, path of a tropical depression over the western Pacific Ocean
Storm path of Tropical Depression 01W (Amang)
A track map showing the path of a typhoon over the western Pacific Ocean; it moves westward for a short time before curving into an erratic, but overall northwestward, motion
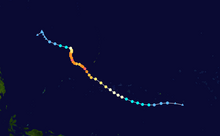
Storm path of Typhoon Wutip (Betty)
An animation showing the structural evolution of a typhoon's innermost core region. Its eye gradually shrinks until it disappears; after some clouds swirl about in the center of the storm, a new eye emerges; the new eye is slightly larger than the old one. The typhoon's clouds are colored with different shades of blue, yellow, green, orange, red, and black; the lighter colors represent shallow convection on the fringes of the typhoon, while the darker colors represent extremely heavy precipitation near the core of the typhoon.
Infrared satellite animation of Typhoon Wutip undergoing an eyewall replacement cycle from February 23 to 25
A photograph of a powerful typhoon over the western Pacific Ocean; there is a nearly circular region of thick white clouds, punctuated by an axisymmetric eye near the center. Bands of showers and thin, high clouds spiral out from the typhoon in all directions.
Satellite image of Typhoon Wutip at its secondary peak intensity west of Guam on February 25
A track map showing the path of a tropical depression over the western Pacific Ocean. It moves west-northwestward at first; around midway through its life, it gently curves into a motion that is generally south of due west.
Storm path of Tropical Depression 03W (Chedeng)
A track map showing the path of a tropical depression over the western Pacific Ocean. The path is short and erratic, occuring within a small area; the shape resembles that of a pirate's hook.
Storm path of the first tropical depression
A track map showing the short, entirely west-northwestward path of a tropical depression over the western Pacific Ocean
Storm path of the second tropical depression
A track map showing the path of a tropical storm over the western Pacific Ocean. The storm initially follows a north-northeastward trajectory; it then curves to the east while located a short distance off the south coast of southern Japan, before switching to an erratic northeastward motion for the rest of its life.
Storm path of Tropical Storm Sepat (Dodong)
A photograph of a tropical storm located just off the coast of southern Japan. The storm's structure mainly consists of a single, irregularly-shaped area of thick convection; areas of high clouds are visible near the storm, particularly to the east and northeast.
Infrared satellite image of Tropical Storm Sepat shortly before reaching peak winds on June 27
A track map showing the path of a tropical depression over the western Pacific Ocean, east of the Philippines. The depression generally moves northwestward (diagonally) for its entire life; its track ends a short distance southeast of Taiwan.
Storm path of Tropical Depression 04W (Egay)
A track map showing the path of a tropical storm over the South China Sea, which is one of the westernmost parts of the Pacific Ocean. The system initially moves in a generally westward direction, traversing the Chinese island of Hainan in the process; after clearing Hainan, it makes a sharp turn to the north-northwest, a motion which takes it over Vietnam.
Storm path of Tropical Storm Mun
A track map showing the path of a tropical storm over the western Pacific Ocean. The system moves in a generally westward direction until it reaches a location just east of the Philippine island of Luzon. At this point, the system abruptly turns northward; this motion continues until the system reaches the Korean peninsula, where it turns to the northeast and continues in that direction until dissipation.
Storm path of Tropical Storm Danas (Falcon)
A photograph of a large and disorganized tropical storm off the east coast of China; the system's structure consists of multiple amorphous blobs of convection, with lower clouds making a circulation evident.
Infrared satellite image of Tropical Storm Danas at its peak intensity near the coast of China on July 18
A track map showing the path of a tropical storm over the western Pacific Ocean; it follows an erratic northward motion until it reaches central Japan, shifting to the east-northeast over land and continuing in that direction until it dissipates
Storm path of Tropical Storm Nari
A track map showing the path of a tropical storm over the South China Sea. It moved in west-northwestward to northwestward motion until it reaches the northeast tip of Hainan, at which point it abruptly turns to the north for a brief time. It shifts to an erratic westward motion that keeps it near the coast of China, eventually bending gently to the west-southwest as it continues into Vietnam.
Storm path of Tropical Storm Wipha
A photograph of a tropical storm near the coasts of southwestern China and northeastern Vietnam. Thick convection spirals around the center, especially on the southern side of the circulation; a large region of high, puffy clouds fans out to the northwest, north, and northeast of the center.
Satellite image of Tropical Storm Wipha at its peak intensity in the Gulf of Tonkin on August 2
A track map showing the path of a typhoon over the western Pacific Ocean. The system initially moves northwestward and curves very gradually to the west-northwest. A shift back to the northwest brings the center of the storm over part of southwestern Japan and along the east coast of the Korean peninsula; from here, it turns to the east, crossing northern Japan and continuing out to sea.
Storm path of Typhoon Francisco
A track map showing the path of a powerful typhoon over the western Pacific Ocean and eastern China. The system moves in a generally northwest-to-north-northwest direction for much of its life, though this motion is erratic at first, including a tight loop. After reaching the coast of eastern China, the system assumes a generally northward trajectory, though it eventually executes another small loop over northeastern China, where it dissipates.
Storm path of Typhoon Lekima (Hanna)
A track map showing the erratic path of a powerful typhoon over the western Pacific Ocean. The system moves northwestward at first, but then stalls before drifting to the east for a short distance. This motion is followed by a drift back to the west before the system resumes its previous northwestward trajectory. While located south of Japan, the system turns to the north, crossing the southwestern portion of the country. After emerging back over water, the system gradually assumes a northeastward motion, which it maintains until dissipation.
Storm path of Typhoon Krosa
A photograph of two powerful typhoons over the western Pacific Ocean. The two typhoons have similar structures: Both have well-defined eyes encircled by deep convection, and large rainbands spiraling around their eastern and southern sides. The two typhoons appear to be connected by a diagonal band of clouds.
Satellite image of Typhoons Lekima (left) and Krosa (right) on August 8
A track map of the path of a tropical storm over the western Pacific Ocean. The storm's track is generally west-northwestward, though it takes a couple brief detours to the north or west. The storm tracks over southern Taiwan and part of eastern China before dissipating.
Storm path of Severe Tropical Storm Bailu (Ineng)
A photograph of a tropical storm over the western Pacific Ocean. The storm possesses an eye-like feature, but convection is limited on the northern half of the circulation; instead, a large area of thick, deep convection is sprawling over the storm's southern half. The overall cloud pattern is tight and well-organized.
Satellite image of Severe Tropical Storm Bailu near Taiwan on August 24
A track map of the straightforward path of a tropical storm over the Philippine Sea and South China Sea; it maintains a generally westward trajectory for its entire existence, crossing the Philippine island of Luzon and landfalling in Vietnam in the process.
Storm path of Tropical Storm Podul (Jenny)
A track map showing the erratic path of a tropical storm over the northern half of the South China Sea. The storm moves westward until it reaches Hainan, at which point it turns to the southwest. It continues this motion until it reaches a short distance inland over Vietnam, where it abruptly executes a loop and turns east-northeastward back out to sea, dissipating east of Hainan.
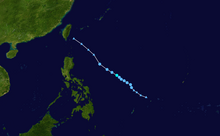
Storm path of Tropical Storm Kajiki (Kabayan)
A track map showing the path of a powerful typhoon over the western Pacific Ocean. It initially moves generally northward, with small deviations to the left and right. The storm eventually reaches the Korean peninsula; at this point, it begins a very gradual turn to the east, tracking over the Russian Far East in the process. It continues eastward until dissipation off the coast of Alaska.
Storm path of Typhoon Lingling (Liwayway)
A track map showing the path of a powerful typhoon over the western Pacific Ocean. It moves in an erratic west-northwestward motion for much of its duration; it curves northward as it approaches Japan, briefly passing over the southeastern portion of the country. It then continues east-northeastward out to sea.
Storm path of Typhoon Faxai
A photograph of the western Pacific Ocean, with three tropical cyclones visible. The tropical cyclones on the left and right are both weak and poorly organized, with lopsided, misshapen convection. The tropical cyclone near the center is much stronger; it is a powerful typhoon with a circular eye surrounded by a thick ring of intense convection. A prominent curved band arcs out to the east and south of the typhoon's center, with extensive cirrus outflow visible along these flanks. Aside from these three tropical cyclones, many other areas of high clouds and/or convection can be seen across the basin.
Satellite image of Tropical Depression Kajiki (left), Typhoon Lingling (center), and Tropical Storm Faxai (right) on September 5
A photograph of a powerful typhoon just to the southeast of Japan. It has a tightly-wound circulation with a well-defined eye at the center, and an extensive area of cirrus outflow along and near the southern flank.
Satellite image of Typhoon Faxai shortly after reaching its peak intensity, while approaching Japan on September 8
A track map showing the erratic path of a tropical depression over the western Pacific Ocean. The depression changes directions multiple times; it moves westward at first, then sharply turns to the northeast before turning to the northwest, after which it shifts back to the northeast. A final hairpin turn takes the depression into a southwestward motion.
Storm path of Tropical Depression Marilyn
A track map showing the path of a tropical storm over the western Pacific Ocean; it generally moves in a west-northwest to northwest motion, though it curves northward at the very end
Storm path of Tropical Storm Peipah
A track map showing the path of a typhoon over the western Pacific Ocean. It starts by moving erratically to the north and west, then settling into a north-northwestward motion. It gradually curves first to the north, and then to the northeast, passing between South Korea and Japan in the process.
Storm path of Typhoon Tapah (Nimfa)
A photograph of a typhoon over the East China Sea; the convection is generally lopsided, being thick on the system's northern side and thin to its south, but the overall cloud pattern is well-organized and tightly wound, with an eye visible near the center.
Satellite image of Typhoon Tapah at its peak intensity in the East China Sea on September 21
A track map of the path of a typhoon over the western Pacific Ocean. The typhoon executes a prolonged C-shaped curve; initially moving to the west-northwest, it curves to the north as it passes just to the east of Taiwan and China. A turn to the northeast brings it over South Korea; it passes over northern Japan after shifting eastward.
Storm path of Typhoon Mitag (Onyok)
A photograph of a weakening, but still strong, tropical storm over the northwestern Pacific Ocean. Although its circulation is still tightly-wound, convection is light on the southern side, mostly limited to cloudiness and rain showers. By contrast, there is an extensive area of deep convection to the north and northeast of the storm, with streaks of high, wispy clouds emanating from the northern edge of the convection. To the west of the storm is an area of puffy, parallel clouds that are indicative of cooler weather; this is a hint that the storm is in the process of transitioning into an extratropical cyclone.
Satellite image of Severe Tropical Storm Mitag approaching the Korean Peninsula on October 2
A photograph of an extremely powerful typhoon over the western Pacific Ocean. It has a pinhole eye surrounded by intense convection; the cloud tops of thunderstorms are billowing near the eye. Gravity waves radiate outward from the eye; this is a characteristic of many powerful tropical cyclones. Large, well-defined rainbands spiral out well to the south of the center of the typhoon. Thin, roughly parallel streaks of high, wispy clouds are emanating to the northeast and southwest of the typhoon, indicating that it has healthy outflow, which is something that helps tropical cyclones to intensify.
Satellite image of Typhoon Hagibis reaching its initial peak intensity over the Northern Mariana Islands on October 7
A track map showing the path of a powerful typhoon over the western Pacific Ocean. Moving generally westward at first, the typhoon gradually curves to the north; a turn to the northeast brings it over Japan before continuing out to sea, where it transitions into an extratropical cyclone. Over the Bering Sea, the system's path becomes highly erratic, looping around the area until dissipation.
Storm path of Typhoon Hagibis
A track map showing the path of a typhoon over the western Pacific Ocean. The system moves to the west-northwest at first, then drifts to the north before resuming its west-northwestward motion. It then shifts to the northeast, a motion it maintains until dissipation just south of Japan.
Storm path of Typhoon Neoguri (Perla)
A track map showing the path of a typhoon over the western Pacific Ocean. Initially moving to the west-northwest, it executes a protracted, smooth curve to the northeast while located well to the southeast of Japan.
Storm path of Typhoon Bualoi
A photograph of a powerful typhoon over the western Pacific Ocean. It has a small, circular, and well-defined eye surrounded by a nearly axisymmetric area of deep convection. A pronounced spiral rainband curves around the typhoon's northern flank; cirrus outflow is prevalent, with thin streaks of high clouds sticking outward from the typhoon in nearly every direction.
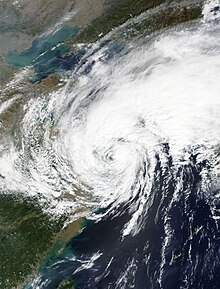
Satellite image of Typhoon Bualoi near its peak intensity on October 22
A track map showing the short and generally westward path of a tropical storm over the South China Sea and Southeast Asia.
Storm path of Severe Tropical Storm Matmo
A track map showing the path of a typhoon over the western Pacific Ocean. The typhoon moves generally northwestward for the first half of its life, then shifts to the northeast for much of the latter half, turning eastward near the end.
Storm path of Typhoon Halong
A photograph of an extremely powerful typhoon over the western Pacific Ocean. The circular eye is almost perfectly clear, and is surrounded by a large, nearly axisymmetric area of intense convection. There are two fragmented rainbands: one to the northeast, oriented horizontally; and the other to the east, oriented vertically. Arcs of thin, high clouds are present along the western, northwestern, and northern flanks of the typhoon.
Infrared satellite image of Typhoon Halong at its peak intensity on November 5
A track map showing the path of a typhoon over the South China Sea. The typhoon initially meanders over a small area, then assumes a westward motion that brings it to the southern coast of Vietnam.
Storm path of Typhoon Nakri (Quiel)
A photograph of a typhoon over the South China Sea. Although the circulation is tightly wound, convection is mostly limited to two spiral rainbands that initiate near the center of the typhoon; these rainbands curl around to the west and southwest of the center. Areas of thin, high clouds are present on all quadrants of the typhoon.
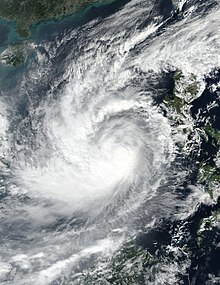
Satellite image of Typhoon Nakri at its peak intensity west of the Philippines on November 8
A track map showing the path of a typhoon over the Philippine and South China Seas. The typhoon's path begins with an erratic northwestward motion just east of the Philippines; a sharp turn to the southwest brings it over the Philippine island of Luzon. The southwestward motion continues over the South China Sea, where the typhoon dissipates.
Storm path of Typhoon Kalmaegi (Ramon)
A track map showing the path of a typhoon over the western Pacific Ocean. The track forms an incomplete spiral; the typhoon initially moves west-northwestward before gradually shifting first to the west, then to the north, then to the east, then to the southeast, and finally to the southwest.
Storm path of Typhoon Fengshen
A photograph of a powerful typhoon over the western Pacific Ocean. It has a small, well-defined eye surrounded by deep convection; prominent rainbands are present on the northern and southern sides, as are arcs of thin, high clouds.
Satellite image of Typhoon Fengshen at its peak intensity on November 15
A track map showing the path of a severe tropical storm over the Philippine and East China Seas. The track begins with an erratic northwestward motion before slowly curving to the north while located just northeast of the Philippines/east of Taiwan. After crossing the Ryukyu Islands and entering the East China Sea, the system abruptly turns to the east-northeast and grazes the southern coast of Japan before dissipating.
Storm path of Severe Tropical Storm Fung-wong (Sarah)
A photograph of a typhoon just northeast of the Philippine island of Luzon. The eye is mostly obscured by clouds, and a majority of the convection is on the northern side of the circulation. A broad area of thin, high clouds is located just to the west of the typhoon.
Satellite image of Typhoon Kalmaegi at its peak intensity northeast of the Philippines on November 19
A track map showing the path of a typhoon over the western Pacific Ocean. It moves westward at first, then shifts to the north for a short time before resuming its westward motion. The typhoon crosses the Philippines and enters the South China Sea, where it turns south and dissipates.
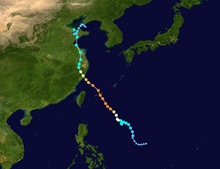
Storm path of Typhoon Kammuri (Tisoy)
A photograph of a powerful typhoon just east of the Philippines. The typhoon's eye is well-defined but mostly obscured by clouds. The core is mostly circular, and consists of intense rainbands coiling toward the center. The typhoon is completely surrounded by large swathes of high clouds.
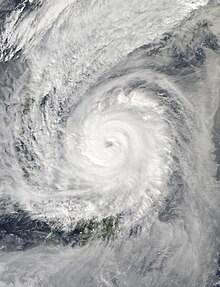
Satellite image of Typhoon Kammuri near its peak intensity on December 2
A track map showing the path of a typhoon over the Philippine and South China Seas. The system starts by moving westward over the Philippine Sea, then assumes a west-northwestward motion that it maintains for most of its life. On this course, the system traverses the central Philippines and enters the South China Sea, where it resumes its former westward motion before dissipating over water.
Storm path of Typhoon Phanfone (Ursula)
A photograph of a powerful typhoon over the west-central Philippines. The eye is mostly obscured by clouds, albeit surrounded by a circular region of deep convection. Three long, thin, and fragmented rainbands extend outward from the core region to the northeast and southeast.
Satellite image of Typhoon Phanfone at its peak intensity while passing through the Philippines on December 25