United States Consumer Price Index
For example, the CPI-U is the most popularly cited measure of consumer inflation in the United States, while the CPI-W is used to index Social Security benefit payments.
Also excluded are income and property taxes, employer-provided benefits, and the portion of healthcare costs paid by insurance plans or government programs such as Medicare, since these prices are not borne directly by consumers.
[11] Beginning in 1983 for the CPI-U (and 1985 for the CPI-W), the pricing method for owned housing uses a framework called Renters' Equivalence.
[12] Prior to this, the CPI would measure the price of homes, the cost of monthly mortgage payments, property taxes, insurance, and maintenance.
In addition, new financial developments at the time meant that the data sources in the old method were becoming unrepresentative of consumers total costs of housing.
The previous method was also unable to account for changes in quality of the sampled housing stock, while the CPI conceptual framework measures the price of a fixed-quality basket of goods.
To aggregate these individual price measurements into an index for the item-location combination, a geometric means formula is usually used:
Its sampling is designed to represent the consumption baskets of residents of urban and metropolitan areas, which collectively account for over 90 percent of the US population.
In many instances, large movements in food and energy prices arise because of supply disruptions such as drought or OPEC-led cutbacks in production.
[27] Since at least 1982, the BLS has also computed a consumer price index for the elderly to account for the fact that the consumption patterns of seniors are different from those of younger people.
For the BLS, "elderly" means that the reference person or a spouse is at least 62 years of age; approximately 24 percent of all consumer units meet this definition.
It is based on the percentage increase in the consumer price index for urban wage earners and clerical workers (CPI-W)".
In 2003 Hobijn and Lagakos estimated that the social security trust fund would run out of money in 40 years using CPI-W and in 35 years using CPI-E.[30] The Consumer Price Index was initiated during World War I, when rapid increases in prices, particularly in shipbuilding centers, made an index essential for calculating cost-of-living adjustments in wages.
To provide appropriate weighting patterns for the index, it reflected the relative importance of goods and services purchased in 92 different industrial centers in 1917–1919.
Periodic collection of prices was started, and in 1919 the Bureau of Labor Statistics began publication of separate indexes for 32 cities.
Because people's buying habits had changed substantially, a new study was made covering expenditures in the years 1934–1936, which provided the basis for a comprehensively revised index introduced in 1940.
During World War II, when many commodities were scarce and goods were rationed, the index weights were adjusted temporarily to reflect these shortages.
In 1951, the BLS again made interim adjustments, based on surveys of consumer expenditures in seven cities between 1947 and 1949, to reflect the most important effects of immediate postwar changes in buying patterns.
In 1978, the index was revised to reflect the spending patterns based upon the surveys of consumer expenditures conducted in 1972–1974.
POPS eliminated reliance on outdated secondary sources for screening samples of establishments or outlets where prices are collected.
The CPI commission found in their study that the index overestimated the cost of living by a value between 0.8 and 1.6 percentage points.
In the 1970s and 80s the federal government began indexing several transfers and taxes including social security (see below Uses of the CPI).
The overestimation of CPI would imply that the increases in these taxes and transfers have been greater than necessary, meaning the government and taxpayers have overpaid for them.
For example, by 1996 there were over 47 million cellular phone users in the United States, but the weights for the CPI did not account for this new product until 1998.
The commission recommended that the BLS update weights more frequently to prevent upward bias in the index from a failure to properly account for the benefits of new products.
Fixed weights do not accommodate consumer substitutions among commodities, such as buying more chicken when the price of beef increases.
[33] The Commission also found that 99% of all data were collected during the week, although an increasing amount of purchases happen during the weekend.
The Federal Reserve's policy of ignoring food and energy prices when making interest rate decisions is often confused with the measurement of the CPI by the Bureau of Labor Statistics.
Some critics believe that changes in CPI calculation due to the Boskin Commission have led to dramatic cuts in inflation estimates.
For example, the BLS has stated that changes made due to the introduction of the geometric mean formula to account for product substitution (one of the Boskin recommended changes) have lowered the measured rate of inflation by less than 0.3% per year, and the methods now used are commonly employed in the CPIs of developed nations.


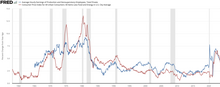
(Percent Change Year/Year)
