Visualization (graphics)
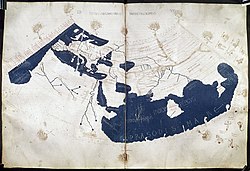
from history include cave paintings, Egyptian hieroglyphs, Greek geometry, and Leonardo da Vinci's revolutionary methods of technical drawing for engineering purposes that actively involve scientific requirements.
[4] Since then, there have been several conferences and workshops, co-sponsored by the IEEE Computer Society and ACM SIGGRAPH, devoted to the general topic, and special areas in the field, for example volume visualization.
Most people are familiar with the digital animations produced to present meteorological data during weather reports on television, though few can distinguish between those models of reality and the satellite photos that are also shown on such programs.
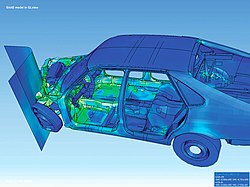
TV also offers scientific visualizations when it shows computer drawn and animated reconstructions of road or airplane accidents.
Some of the most popular examples of scientific visualizations are computer-generated images that show real spacecraft in action, out in the void far beyond Earth, or on other planets.
[citation needed] Dynamic forms of visualization, such as educational animation or timelines, have the potential to enhance learning about systems that change over time.
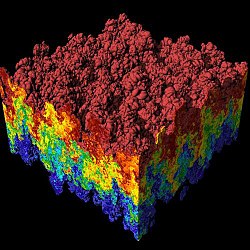
Scientific visualization focuses and emphasizes the representation of higher order data using primarily graphics and animation techniques.
There are several different techniques to visualize scientific data, with isosurface reconstruction and direct volume rendering being the more common.
[7] Information visualization concentrates on the use of computer-supported tools to explore large amount of abstract data.
The term "information visualization" was originally coined by the User Interface Research Group at Xerox PARC and included Jock Mackinlay.
[citation needed] Practical application of information visualization in computer programs involves selecting, transforming, and representing abstract data in a form that facilitates human interaction for exploration and understanding.
Strong techniques enable the user to modify the visualization in real-time, thus affording unparalleled perception of patterns and structural relations in the abstract data in question.
[9] Knowledge transfer may be significantly improved using hybrid designs as it enhances information density but may decrease clarity as well.
Visual analytics research concentrates on support for perceptual and cognitive operations that enable users to detect the expected and discover the unexpected in complex information spaces.
Technologies resulting from visual analytics find their application in almost all fields, but are being driven by critical needs (and funding) in biology and national security.
The people then make annotations to the visualization as well as communicate via audio (i.e., telephone), video (i.e., a video-conference), or text (i.e., IRC) messages.
Input devices range from the common – keyboards, mice, graphics tablets, trackballs, and touchpads – to the esoteric – wired gloves, boom arms, and even omnidirectional treadmills.
Experiments have shown that a delay of more than 20 ms between when input is provided and a visual representation is updated is noticeable by most people [citation needed].