Wave run-up
, is a very important parameter in coastal engineering as, together with the design highest still water level, it determines the required crest height of a dike or revetment.
The first scientific measurements of wave run-up were carried out by the Lorentz Committee in preparation for the works to close off the Zuiderzee.
The methods and technology available to the committee at the time did not permit model testing of the more realistic and complex irregular waves (consisting of varying heights, periods and directions), which provide a more accurate representation of the actual conditions faced by coastal structures and shorelines.
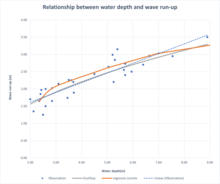
It was found, however, that the depth in front of the dike is very important for wave run-up and that, at least for the range of observations in the committee's measurements, the slope ratio does not play a major role.
Current knowledge indicates that during storms and on gentle coastal slopes, the significant wave height is approximately half the water depth.
In 1988, van der Meer provided formulae for wave run-up on rubble mound breakwaters, based on tests with rock-armoured straight slopes.
are presented in the table below: The values of the coefficients highlight the considerable variability of the run-up level from one wave to another in irregular seas.
[6] For run-up levels on smooth slopes, work in the Netherlands by the Technische Adviescommissie voor de Waterkeringen (English: Technical Advisory Committee on water Defences) in 1974 discussed the reduction in run-up due to different types of surface roughness.
These waves are typically analysed using statistical methods and spectral analysis, providing a more accurate representation of the actual conditions faced by coastal structures and shorelines.
A probability of exceedance value has been chosen that is small enough to prevent overtopping waves from causing damage to the inner slope.
The 2% value has been adopted internationally and was arbitrarily selected by the Dutch Waterloopkundig Laboratorium shortly before 1940.
The choice of 2% was based on the duration of experimental designs, as a complete trial could be conducted in half a day.
In 1972, Jurjen Battjes, commissioned by the Dutch Technical Advisory Committee for Flood Defences, summarised the available research and provided a solid theoretical foundation.
[8][9] This work led to an improved version of Hunt's Formula, which explicitly included parameters for the angle of incidence of the waves, the effect of a berm, and the slope's roughness.
However, the available experimental data on roughness and the berm were insufficient to establish a definitive formula.
[10] The wave run-up formula mentioned in this report remains in use, and the EurOtop manual has adopted it.
The scope of validity has been further expanded in the EurOtop manual, featuring modified formulas.
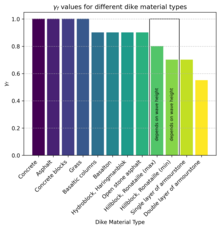
The following equation is valid: in which: A range is provided for Hillblock and Ronataille materials, as their reduction coefficient is dependent on wave height.
When subjected to high waves, natural grass becomes very smooth, resulting in a reduction coefficient
[5] For wave run-down there is a similar formula:[12] Following storm events, a layer of floating debris, known as the flood mark or flotsam, often remains on the slope.
This tide mark indicates the maximum wave run-up during the preceding storm.
The freeboard at the design water level must be equal to the maximum permissible wave run-up.
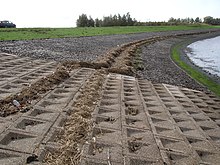
An example of this can be observed in the accompanying photo of the run-up and flood mark lines at a dike along the Bathpolder in Zeeland.
The photo shows two flood mark lines, which represent the wave run-up of two subsequent storms (on October 12, 2009, with water levels at 2.2 metres (7 ft 3 in) and 1.9 metres (6 ft 3 in) above mean sea level) in the Bathpolder.
Subsequent analysis reveals that the reduction coefficient γf for Haringman blocks here is 1.0, and for Elastocoast, it is 0.8.
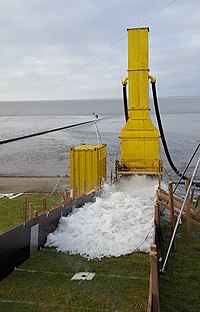
To assess the safety of a dike and the durability of its grass cover, particularly on the sea or river side, a wave run-up simulator can be employed.
The wave conditions for which a dike is designed are infrequent, and the strength of grass coverings varies.
These dike conditions can be replicated in-situ using a wave run-up simulator, allowing the manager of the relevant flood defence system to determine if the grass cover is strong enough to withstand expected waves under extreme conditions.
[11] During these tests, the wave run-up simulator is placed on the outer slope and continuously filled with water at a constant flow rate.
[15] The wave run-up simulator is one method for assessing the strength of the grass cover.


,

where is the reduction coefficient and is the Iribarren number. Different materials exhibit varying roughness factors, influencing the wave run-up height. This graph compares the wave run-up for double layer armourstone, single layer armourstone, and asphalt for a breakwater with T=6s, Lo=100m, =0 and berm width =3m.