Analysis of covariance
Analysis of covariance (ANCOVA) is a general linear model that blends ANOVA and regression.
Intuitively, ANCOVA can be thought of as 'adjusting' the DV by the group means of the CV(s).
[1] The ANCOVA model assumes a linear relationship between the response (DV) and covariate (CV):
is the jth observation under the ith categorical group; the CV,
(the associated unobserved error term for the jth observation in the ith group).
The standard assumptions of the linear regression model are also assumed to hold, as discussed below.
[2] In an agricultural study, ANCOVA can be used to analyze the effect of different fertilizers (
Soil quality, a continuous variable, influences crop yield and may vary across plots, potentially confounding the results.
By adjusting for soil quality, ANCOVA provides a more precise estimate of the fertilizer effect on crop yield.
ensures that the categorical variable's effects are centered around zero, allowing for meaningful interpretation of group differences.
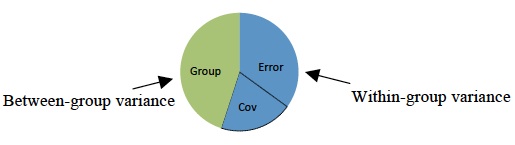
ANCOVA can be used to increase statistical power (the probability a significant difference is found between groups when one exists) by reducing the within-group error variance.
The F-test is computed by dividing the explained variance between groups (e.g., medical recovery differences) by the unexplained variance within the groups.
Thus, If this value is larger than a critical value, we conclude that there is a significant difference between groups.
When we control for the effect of CVs on the DV, we remove it from the denominator making F larger, thereby increasing our power to find a significant effect if one exists at all.
Another use of ANCOVA is to adjust for preexisting differences in nonequivalent (intact) groups.
In this situation, participants cannot be made equal through random assignment, so CVs are used to adjust scores and make participants more similar than without the CV.
However, even with the use of covariates, there are no statistical techniques that can equate unequal groups.
Furthermore, the CV may be so intimately related to the categorical IV that removing the variance on the DV associated with the CV would remove considerable variance on the DV, rendering the results meaningless.
[4] There are several key assumptions that underlie the use of ANCOVA and affect interpretation of the results.
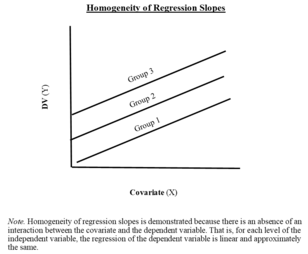
[2] The standard linear regression assumptions hold; further we assume that the slope of the covariate is equal across all treatment groups (homogeneity of regression slopes).
The error is a random variable with conditional zero mean and equal variances for different treatment classes and observations.
The fifth issue, concerning the homogeneity of different treatment regression slopes is particularly important in evaluating the appropriateness of ANCOVA model.
To see if the CV significantly interacts with the categorical IV, run an ANCOVA model including both the IV and the CVxIV interaction term.
Instead, Green & Salkind[5] suggest assessing group differences on the DV at particular levels of the CV.
Also consider using a moderated regression analysis, treating the CV and its interaction as another IV.
Alternatively, one could use mediation analyses to determine if the CV accounts for the IV's effect on the DV[citation needed].
[6] To find exactly which levels are significantly different from one another, one can use the same follow-up tests as for the ANOVA.
One can investigate the simple main effects using the same methods as in a factorial ANOVA.
While the inclusion of a covariate into an ANOVA generally increases statistical power[7] by accounting for some of the variance in the dependent variable and thus increasing the ratio of variance explained by the independent variables, adding a covariate into ANOVA also reduces the degrees of freedom.
Accordingly, adding a covariate which accounts for very little variance in the dependent variable might actually reduce power.