Regression validation
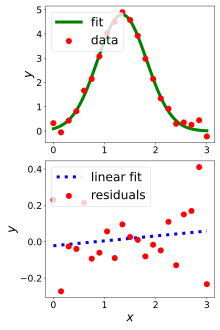
On the other hand, if non-random structure is evident in the residuals, it is a clear sign that the model fits the data poorly.
If a visual examination suggests, for example, the possible presence of heteroscedasticity (a relationship between the variance of the model errors and the size of an independent variable's observations), then statistical tests can be performed to confirm or reject this hunch; if it is confirmed, different modeling procedures are called for.
For example, the lack-of-fit test for assessing the correctness of the functional part of the model can aid in interpreting a borderline residual plot.
Logistic regression with binary data is another area in which graphical residual analysis can be difficult.
Cross-validation is the process of assessing how the results of a statistical analysis will generalize to an independent data set.
Essentially it measures a type of normalized prediction error and its distribution is a linear combination of χ2 variables of degree 1.
[1] This article incorporates public domain material from the National Institute of Standards and Technology