The infalling material (which contains galaxies, gas and dark matter) gains kinetic energy as it falls into the cluster's gravitational potential well.
On board the Compton Gamma Ray Observatory (CGRO) is the Burst and Transient Source Experiment (BATSE) which detects in the 20 keV to 8 MeV range.
To fall into the class of intermediate-mass black holes (IMBHs), their luminosities, thermal disk emissions, variation timescales, and surrounding emission-line nebulae must suggest this.
Similar luminous accretion disks can also form around white dwarfs and neutron stars, but in these the infalling gas releases additional energy as it slams against the high-density surface with high speed.
[12] In the late 1930s, the presence of a very hot, tenuous gas surrounding the Sun was inferred indirectly from optical coronal lines of highly ionized species.
SXT was sensitive to plasma in the 2–4 MK temperature range, making it an ideal observational platform to compare with data collected from TRACE coronal loops radiating in the EUV wavelengths.
Super soft X-rays are believed to be produced by steady nuclear fusion on a white dwarf's surface of material pulled from a binary companion.
When combined with the rapid rotation that most brown dwarfs exhibit, convection sets up conditions for the development of a strong, tangled magnetic field near the surface.
[24] "Our Chandra data show that the X-rays originate from the brown dwarf's coronal plasma which is some 3 million degrees Celsius", said Yohko Tsuboi of Chuo University in Tokyo.
As shown by the swept-back appearance in the illustration, gusts of particles from the Sun also distort Jupiter's magnetic field, and on occasion produce auroras.
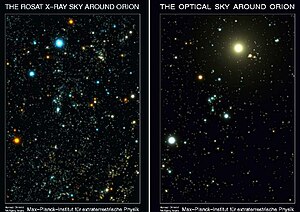
The background sky has an X-ray glow in part due to the myriad of distant, powerful active galaxies, unresolved in the ROSAT picture.
[25] This causes the solar wind to light up with X-rays, and that's what Swift's XRT sees", said Stefan Immler, of the Goddard Space Flight Center.
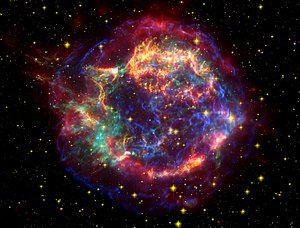
Regarding Cassiopea A SNR, it is believed that first light from the stellar explosion reached Earth approximately 300 years ago but there are no historical records of any sightings of the progenitor supernova, probably due to interstellar dust absorbing optical wavelength radiation before it reached Earth (although it is possible that it was recorded as a sixth magnitude star 3 Cassiopeiae by John Flamsteed on 16 August 1680[29]).
[30] Three structures around Eta Carinae are thought to represent shock waves produced by matter rushing away from the superstar at supersonic speeds.
"The Chandra image contains some puzzles for existing ideas of how a star can produce such hot and intense X-rays," says Prof. Kris Davidson of the University of Minnesota.
"[35] HD 104237 (spectral type A4e) observed by ASCA, located in the Chamaeleon III dark cloud, is the brightest Herbig Ae/Be star in the sky.
There is an exceptionally large number of black holes in the rim of the galaxy as can be seen in the inset.As of 27 August 2007, discoveries concerning asymmetric iron line broadening and their implications for relativity have been a topic of much excitement.
With respect to the asymmetric iron line broadening, Edward Cackett of the University of Michigan commented, "We're seeing the gas whipping around just outside the neutron star's surface,".
It shows that the way neutron stars accrete matter is not very different from that of black holes, and it gives us a new tool to probe Einstein's theory", says Tod Strohmayer of NASA's Goddard Space Flight Center.
Cackett and Jon Miller of the University of Michigan, along with Bhattacharyya and Strohmayer, used Suzaku's superb spectral capabilities to survey Serpens X-1.
This does not represent an actual velocity of the system away from the Earth; rather, it is due to time dilation, which makes moving clocks appear to stationary observers to be ticking more slowly.
Discovered in 1997, remaining active only one day, with an X-ray spectrum well fitted with a thermal bremsstrahlung (temperature of ~20 keV), resembling the spectral properties of accreting pulsars, it was at first classified as a peculiar Be/X-ray transient with an unusually short outburst.
Other remarkable features observed include narrow X-ray emitting filaments up to 100,000 light-years long, and a large cavity in the hot gas caused by a major eruption 70 million years ago.
The theory regarding these objects was proposed by Robert Duncan and Christopher Thompson in 1992, but the first recorded burst of gamma rays thought to have been from a magnetar was on 5 March 1979.
[49] And, Konus detected another source in March 1979: SGR 1900+14, located 20,000 light-years away in the constellation Aquila had a long period of low emissions, except the significant burst in 1979, and a couple after.
NASA's Rossi X-ray Timing Explorer (RXTE) has revealed that the youngest known pulsing neutron star has thrown a temper tantrum.
[13] The cause of the X-ray deficiency may involve Prominent bright red giants include Aldebaran, Arcturus, and Gamma Crucis.
There is also a rather abrupt onset of X-ray emission around spectral type A7-F0, with a large range of luminosities developing across spectral class F.[13] In the few genuine late A- or early F-type coronal emitters, their weak dynamo operation is generally not able to brake the rapidly spinning star considerably during their short lifetime so that these coronae are conspicuous by their severe deficit of X-ray emission compared to chromospheric and transition region fluxes; the latter can be followed up to mid-A type stars at quite high levels.
The resultant structures – of varying sizes – can be observed, such as stellar wind bubbles and superbubbles of hot gas, by X-ray satellite telescopes.
[1] The ROSAT soft X-ray diffuse background (SXRB) image shows the general increase in intensity from the Galactic plane to the poles.
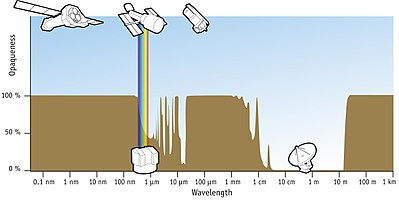
X-rays start at ~0.008 nm and extend across the electromagnetic spectrum to ~8 nm, over which Earth's atmosphere is
opaque
.
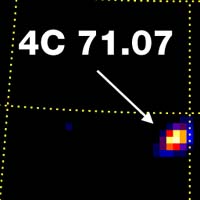
A view of 4C 71.07 from observations by the Burst and Transient Source Experiment. This helped convince scientists that they were studying data from the quasar and not some other source in the neighborhood.
In visible light, 4C 71.07 is less than impressive, just a distant speck of light. It is in radio and in X-rays – and now, gamma rays – that this object really shines. 4C 71.07 is its designation in the Fourth Cambridge Survey of radio sources. Its redshift of z=2.17, puts it about 11 billion years away in a 12 to 15-billion year-old universe (using z=1 as 5 billion light years).
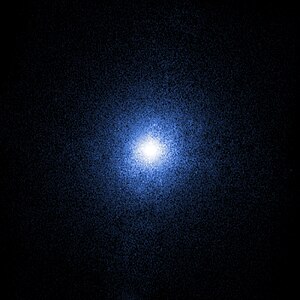
Chandra image of
Cygnus X-1
, which was the first strong black hole candidate to be discovered.
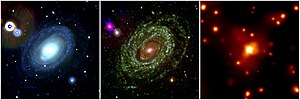
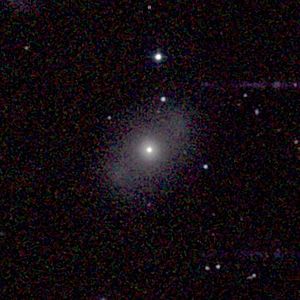
Supernova 2005ke, which was detected in 2005, is a Type Ia supernova, an important "standard candle" explosion used by astronomers to measure distances in the universe. Shown here is the event in optical, ultraviolet and X-ray wavelengths. This is the first X-ray image of a Type Ia, and it has provided observational evidence that Type Ia are the explosion of a white dwarf orbiting a red giant star.
This light curve of Her X-1 shows long term and medium term variability. Each pair of vertical lines delineate the eclipse of the compact object behind its companion star. In this case, the companion is a 2 Solar-mass star with a radius of nearly four times that of the Sun. This eclipse shows us the orbital period of the system, 1.7 days.
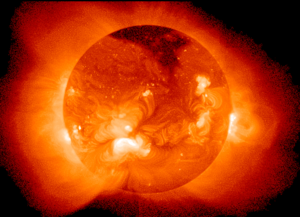
The corona of the Sun as seen in the X-ray region of the
electromagnetic spectrum
on 8 May 1992 by the soft X-ray telescope on board the
Yohkoh
solar observatory spacecraft.
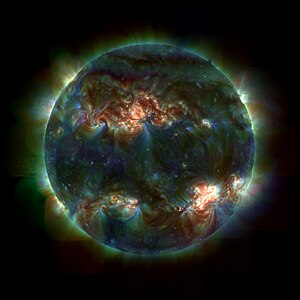
This is a false-color, 3-layer composite from the
TRACE
observatory: the blue, green, and red channels show the 17.1 nm, 19.5 nm, and 28.4 nm, respectively. These TRACE filters are most sensitive to emission from 1, 1.5, and 2 million degree plasma, thus showing the entire corona and detail of coronal loops in the lower solar atmosphere.
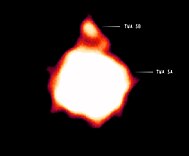
Chandra image of LP 944-20 before flare and during flare.
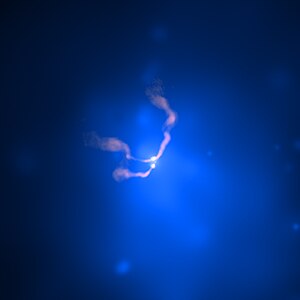
Chandra observation of TWA 5B.
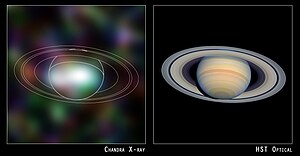
Chandra X-ray (left) and Hubble optical (right) images of Saturn on 14 April 2003. Observation period: 20 hrs, 14–15 April 2003. Color code: red (0.4 – 0.6 keV), green (0.6 – 0.8 keV), blue (0.8 – 1.0 keV).
Jupiter shows intense X-ray emission associated with auroras in its polar regions (Chandra observatory X-ray image on the left). The accompanying schematic illustrates how Jupiter's unusually frequent and spectacular auroral activity is produced. Jupiter's strong, rapidly rotating magnetic field (light blue lines) generates strong electric fields in the space around the planet. Charged particles (white dots), trapped in Jupiter's magnetic field, are continually being accelerated (gold particles) down into the atmosphere above the polar regions, so auroras are almost always active on Jupiter. Observation period: 17 hrs, 24–26 February 2003.
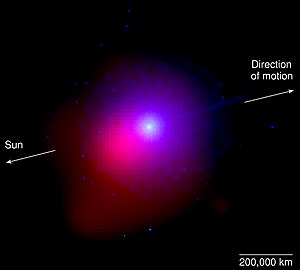
Comet Lulin
was passing through the constellation Libra when
Swift
imaged it on 28 January 2009. This image merges data acquired by Swift's Ultraviolet/Optical Telescope (blue and green) and X-Ray Telescope (red). At the time of the observation, the comet was 99.5 million miles from Earth and 115.3 million miles from the Sun.
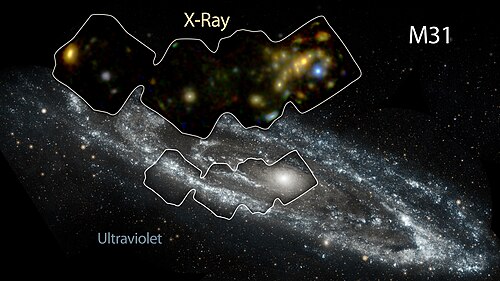
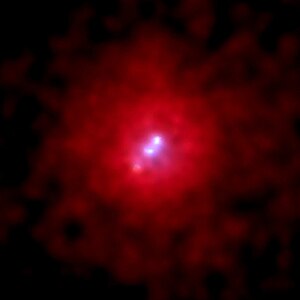
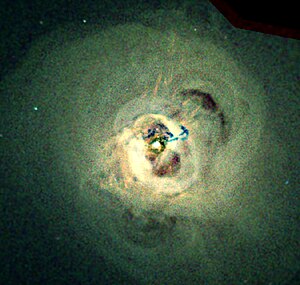
Using the orbiting Chandra X-ray telescope, astronomers have imaged the center of our near-twin island universe, finding evidence for a bizarre object. Like the Milky Way,
Andromeda
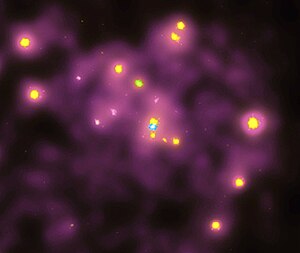
's galactic center appears to harbor an X-ray source characteristic of a black hole of a million or more solar masses. Seen above, the false-color X-ray picture shows a number of X-ray sources, likely X-ray binary stars, within Andromeda's central region as yellowish dots. The blue source located right at the galaxy's center is coincident with the position of the suspected massive black hole. While the X-rays are produced as material falls into the black hole and heats up, estimates from the X-ray data show Andromeda's central source to be very cold – only about million degrees, compared to the tens of millions of degrees indicated for Andromeda's X-ray binaries.
Chandra image of
3C 295
, a strongly X-ray emitting galaxy cluster in the constellation
Boötes
. The cluster is filled with gas. Image is 42 arcsec across.
RA
14
h
11
m
20
s
Dec
−52° 12' 21". Observation date: 30 August 1999. Instrument: ACIS. Aka: Cl 1409+524
Chandra image of the hot X-ray emitting gas that pervades the galaxy cluster MS 0735.6+7421 in Camelopardus. Two vast cavities – each 600,000 lyrs in diameter appear on opposite sides of a large galaxy at the center of the cluster. These cavities are filled with a two-sided, elongated, magnetized bubble of extremely high-energy electrons that emit radio waves. Image is 4.2 arcmin per side.
RA
07
h
41
m
50.20
s
Dec
+74° 14' 51.00" in
Camelopardus
. Observation date: 30 November 2003.
Classified as a
peculiar star
,
Eta Carinae
exhibits a superstar at its center as seen in this image from
Chandra
. The new X-ray observation shows three distinct structures: an outer, horseshoe-shaped ring about 2 light years in diameter, a hot inner core about 3 light-months in diameter, and a hot central source less than 1 light-month in diameter which may contain the superstar that drives the whole show. The outer ring provides evidence of another large explosion that occurred over 1,000 years ago.
Two supermassive black holes spiraling towards merger near the center of
NGC 1128
, some 25,000 light years away from each other.
This shows a
ROSAT
false-color image in X-rays between 500 eV and 1.1 keV of the Chamaeleon I dark cloud. The contours are 100 μm emission from dust measured by the IRAS satellite.
Chandra X-ray Observatory image of the galaxy cluster
Abell 2142
.
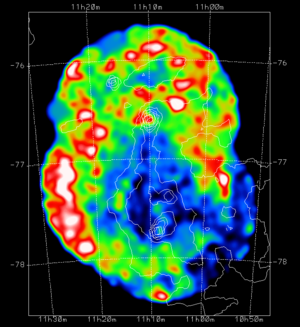
The Chandra X-ray image is of the quasar PKS 1127-145, a highly luminous source of X-rays and visible light about 10 billion light years from Earth. An enormous X-ray jet extends at least a million light years from the quasar. Image is 60 arcsec on a side. RA 11h 30 m 7.10s Dec −14° 49' 27" in Crater. Observation date: 28 May 2000. Instrument: ACIS.
This ROSAT PSPC false-color image is of a portion of a nearby stellar wind superbubble (the
Orion-Eridanus Bubble
) stretching across
Eridanus
and
Orion
. Soft X-rays are emitted by hot gas (T ~ 2–3 MK) in the interior of the superbubble. This bright object forms the background for the "shadow" of a filament of gas and dust. The filament is shown by the overlaid contours, which represent 100 micrometre emission from dust at a temperature of about 30 K as measured by
IRAS
. Here the filament absorbs soft X-rays between 100 and 300 eV, indicating that the hot gas is located behind the filament. This filament may be part of a shell of neutral gas that surrounds the hot bubble. Its interior is energized by UV light and stellar winds from hot stars in the Orion OB1 association. These stars energize a superbubble about 1200 lys across which is observed in the optical (Hα) and X-ray portions of the spectrum.
This Chandra X-ray image reveals a large cloud of hot gas that extends throughout the Hydra A galaxy cluster. Image is 2.7 arcmin across.
RA
09
h
18
m
06
s
Dec
−12° 05' 45" in
Hydra
. Observation date: 30 October 1999. Instrument: ACIS.
Chandra image of two galaxies (Arp 270) in the early stage of a merger in the constellation
Leo Minor
. In the image, red represents low, green intermediate, and blue high-energy (temperature) X-rays. Image is 4 arcmin on a side. RA 10h 49 m 52.5s Dec +32° 59' 6". Observation date: 28 April 2001. Instrument: ACIS.
On the right is the visual image of the constellation
Orion
. On the left is Orion as seen in X-rays only. Betelgeuse is easily seen above the three stars of Orion's belt on the right. The X-ray colors represent the temperature of the X-ray emission from each star: hot stars are blue-white and cooler stars are yellow-red. The brightest object in the optical image is the full moon, which is also in the X-ray image. The X-ray image was actually obtained by the
ROSAT
satellite during the All-Sky Survey phase in 1990–1991.
Stephan's Quintet
, a compact group of galaxies discovered about 130 years ago and located about 280 million light years from Earth, provides a rare opportunity to observe a galaxy group in the process of evolving from an X-ray faint system dominated by spiral galaxies to a more developed system dominated by elliptical galaxies and bright X-ray emission. Being able to witness the dramatic effect of collisions in causing this evolution is important for increasing our understanding of the origins of the hot, X-ray bright halos of gas in groups of galaxies.
Chandra observations of the central regions of the Perseus galaxy cluster. Image is 284 arcsec across.
RA
03
h
19
m
47.60
s
Dec
+41° 30' 37.00" in
Perseus
. Observation dates: 13 pointings between 8 August 2002 and 20 October 2004. Color code: Energy (Red 0.3–1.2 keV, Green 1.2-2 keV, Blue 2–7 keV). Instrument: ACIS.
This Chandra X-ray image of Radio Galaxy Pictor A shows a spectacular jet emanating from the center of the galaxy (left) and extends across 360 thousand lyr toward a brilliant hot spot. Image is 4.2 arcmin across. RA 05h 19 m 49.70s Dec −45° 46' 45" in Pictor. Instrument: ACIS.
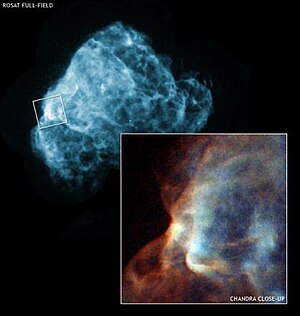
The Chandra three-color image (inset) is a region of the supernova remnant Puppis A (wide-angle view from ROSAT in blue). reveals a cloud being torn apart by a shock wave produced in a supernova explosion. ROSAT image is 88 arcmin across; Chandra image 8 arcmin across.
RA
08
h
23
m
08.16
s
Dec
−42° 41' 41.40" in Puppis. Observation date: 4 September 2005. Color code: Energy (Red 0.4–0.7 keV; Green 0.7–1.2 keV; Blue 1.2–10 keV). Instrument: ACIS.
Sagittarius A
(or Sgr A) is a complex at the center of the Milky Way. It consists of three overlapping components, the
SNR
Sagittarius A East, the spiral structure Sagittarius A West, and a very bright compact radio source at the center of the spiral,
Sagittarius A*
.
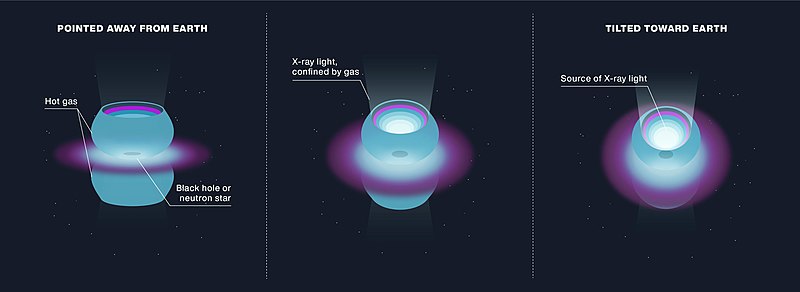
XMM-Newton
spectrum from superheated iron atoms at the inner edge of the accretion disk orbiting the neutron star in Serpens X-1. The line is usually a symmetrical peak, but it exhibits the classic features of distortion due to relativistic effects. The extremely fast motion of the iron-rich gas causes the line to spread out. The entire line has been shifted to longer wavelengths (left, red) because of the neutron star's powerful gravity. The line is brighter toward shorter wavelengths (right, blue) because Einstein's special theory of relativity predicts that a high-speed source beamed toward Earth will appear brighter than the same source moving away from Earth.
Chandra mosaic of the X-ray sources in the
Lockman Hole
. Color code: Energy (red 0.4-2keV, green 2-8keV, blue 4-8keV). Image is about 50 arcmin per side.
Magnetar SGR 1900+14 is in the exact center of the image, which shows a surrounding ring of gas 7
ly
across in infrared light, as seen by the
Spitzer Space Telescope
. The magnetar itself is not visible at this wavelength, but it has been seen in X-ray light.
Chandra
image shows the supernova Kes 75 with the young, normal pulsar, neutron star PSR J1846-0258 in the center of the blue area at the top.
These
Chandra
images show PSR J1846-0258 in Kes 75 in October 2000 (left) and June 2006 (right). The pulsar brightened in X-rays after giving off powerful outbursts earlier in 2006.
Map of the column density of Galactic neutral hydrogen in the same projection as the 0.25 keV SXRB. Note the general negative correlation between the 0.25 keV diffuse X-ray background and the neutral hydrogen column density shown here.
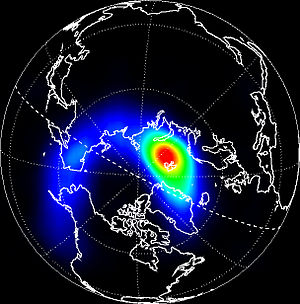
This composite image contains the first picture of the Earth in X-rays, taken in March 1996, with the orbiting
Polar
satellite. The area of brightest X-ray emission is red. Such X-rays are not dangerous because they are absorbed by lower parts of the Earth's
atmosphere
.
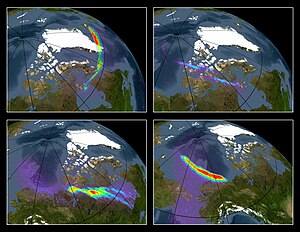
In this sample of images from 2004, bright X-ray arcs of low energy (0.1 – 10 keV) are generated during auroral activity. The images are superimposed on a simulated image of Earth. The color code of the X-ray arcs represent brightness, with maximum brightness shown in red. Distance from the North pole to the black circle is 3,340 km (2,080 mi). Observation dates: 10 pointings between 16 December 2003 – 13 April 2004. Instrument: HRC.