Biodiversity loss
[27][28][29] The fast-growing extinction trends of various animal groups like mammals, birds, reptiles, amphibians, and fish have led scientists to declare a current biodiversity crisis in both land and ocean ecosystems.
[42][43] To measure biodiversity loss rates for a particular location, scientists record the species richness and its variation over time in that area.
[47] An October 2020 analysis by Swiss Re found that one-fifth of all countries are at risk of ecosystem collapse as the result of anthropogenic habitat destruction and increased wildlife loss.
They include habitat destruction, such as intensive agriculture, the use of pesticides (particularly insecticides), introduced species, and – to a lesser degree and only for some regions – the effects of climate change.
[72] Earthworms play an important role in ecosystem function,[72] helping with biological processing in soil, water, and even greenhouse gas balancing.
The possible causes include habitat destruction and modification, diseases, exploitation, pollution, pesticide use, introduced species, and ultraviolet-B radiation (UV-B).
Alongside the simultaneous halving of plant biomass, these striking declines are considered part of the prehistoric phase of the Holocene extinction.
[95] The majority are threatened by habitat loss, but activities such as logging of wild timber trees and collection of medicinal plants, or the introduction of non-native invasive species, also play a role.
[102][108] Examples of extinct marine species include Steller's sea cow (Hydrodamalis gigas) and the Caribbean monk seal (Monachus tropicalis).
For example, in the 1930s, the eelgrass limpet (Lottia alveus) became extinct in the Atlantic once the Zostera marina seagrass population declined upon exposure to a disease.
[102] The main causes of current biodiversity loss are: Jared Diamond describes an "Evil Quartet" of habitat destruction, overkill, introduced species and secondary extinctions.
[110] Edward O. Wilson suggested the acronym HIPPO for the main causes of biodiversity loss: Habitat destruction, Invasive species, Pollution, human over-Population and Over-harvesting.
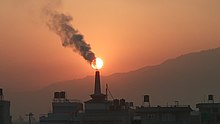
[130] For example, "air pollution causes or contributes to acidification of lakes, eutrophication of estuaries and coastal waters, and mercury bioaccumulation in aquatic food webs".
[130] Noise generated by traffic, ships, vehicles, and aircraft can affect the survivability of wildlife species and can reach undisturbed habitats.
[132] One study found that as seismic noises and naval sonar increases in marine ecosystems, cetacean diversity decreases (including whales and dolphins).
[133] Multiple studies have found that fewer fishes, such as cod, haddock, rockfish, herring, sand seal, and blue whiting, have been spotted in areas with seismic noises, with catch rates declining by 40–80%.
[138] Fossil fuel extraction and associated oil and gas pipelines have major impacts on the biodiversity of many biomes due to land conversion, habitat loss and degradation, and pollution.
The term applies to natural resources such as water aquifers, grazing pastures and forests, wild medicinal plants, fish stocks and other wildlife.
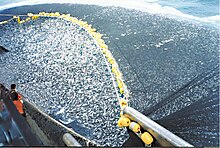
A 2019 Intergovernmental Science-Policy Platform on Biodiversity and Ecosystem Services report found that overfishing is the main driver of mass species extinction in oceans.
[149][150][1][11] Review articles, including the 2019 IPBES report, have also noted that human population growth and overconsumption are significant drivers of species decline.
[13] They argue that the main driver is the loss of habitat, caused by "the growth of commodities for export, particularly soybean and oil-palm, primarily for livestock feed or biofuel consumption in higher income economies.
[18][19] A 2021 collaborative report by scientists from the IPBES and the IPCC found that biodiversity loss and climate change must be addressed simultaneously, as they are inextricably linked and have similar effects on human well-being.
Due to this rapid change, for example cold-blooded animals (a category which includes amphibians, reptiles and all invertebrates) may struggle to find a suitable habitat within 50 km of their current location at the end of this century (for a mid-range scenario of future global warming).
"[185][186] The report also said, "Many of the drivers that have negative impacts on BFA (biodiversity for food and agriculture), including overexploitation, overharvesting, pollution, overuse of external inputs, and changes in land and water management, are at least partially caused by inappropriate agricultural practices"[187]: 6 and "transition to intensive production of a reduced number of species, breeds and varieties, remain major drivers of loss of BFA and ecosystem services.
[23][24] The 2020 CBD report highlighted that if the status quo does not change, biodiversity will continue to decline due to "currently unsustainable patterns of production and consumption, population growth and technological developments".
[199][200] The report also singled out Australia, Brazil, Cameroon and the Galapagos Islands (Ecuador) for having had one of its animals lost to extinction in the previous ten years.
[202] Some experts contend that the United States' refusal to ratify the Convention on Biological Diversity is harming global efforts to halt the extinction crisis.
[150][1] Others have raised concerns that the Convention on Biological Diversity does not go far enough, and argue the goal should be zero extinctions by 2050, along with cutting the impact of unsustainable food production on nature by half.
Its fifth target is: "Take urgent and significant action to reduce the degradation of natural habitats, halt the loss of biodiversity and, by 2020, protect and prevent the extinction of threatened species.
[210] Nearly three-quarters of bird species, two thirds of mammals and more than half of hard corals have been recorded at World Heritage Sites, even though they cover less than 1% of the planet.