Neural oscillation
At the level of neural ensembles, synchronized activity of large numbers of neurons can give rise to macroscopic oscillations, which can be observed in an electroencephalogram.
Oscillatory activity in the brain is widely observed at different levels of organization and is thought to play a key role in processing neural information.
This phenomenon is typically observed as the spectral intensity decreases from the summation of these neurons firing, which can be utilized to differentiate cognitive function or neural isolation.
In general, EEG signals have a broad spectral content similar to pink noise, but also reveal oscillatory activity in specific frequency bands.
The first discovered and best-known frequency band is alpha activity (8–12 Hz)[11][12][13] that can be detected from the occipital lobe during relaxed wakefulness and which increases when the eyes are closed.
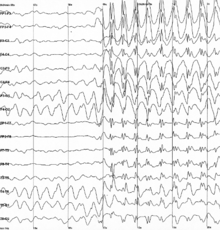
Neural oscillations also play an important role in many neurological disorders, such as excessive synchronization during seizure activity in epilepsy, or tremor in patients with Parkinson's disease.
In particular, inhibitory interneurons play an important role in producing neural ensemble synchrony by generating a narrow window for effective excitation and rhythmically modulating the firing rate of excitatory neurons.
The dynamics of these ion channels have been captured in the well-established Hodgkin–Huxley model that describes how action potentials are initiated and propagated by means of a set of differential equations.
For example, neuronal activity generated by two populations of interconnected inhibitory and excitatory cells can show spontaneous oscillations that are described by the Wilson-Cowan model.
[38] Long-range connections between different brain structures, such as the thalamus and the cortex (see thalamocortical oscillation), involve time-delays due to the finite conduction velocity of axons.
Oscillations recorded from multiple cortical areas can become synchronized to form large-scale brain networks, whose dynamics and functional connectivity can be studied by means of spectral analysis and Granger causality measures.
[40] In addition to fast direct synaptic interactions between neurons forming a network, oscillatory activity is regulated by neuromodulators on a much slower time scale.
These neurotransmitter systems affect the physiological state, e.g., wakefulness or arousal, and have a pronounced effect on amplitude of different brain waves, such as alpha activity.
The model is based on data from the squid giant axon and consists of nonlinear differential equations that approximate the electrical characteristics of a neuron, including the generation and propagation of action potentials.
[45][46] Such models only capture salient membrane dynamics such as spiking or bursting at the cost of biophysical detail, but are more computationally efficient, enabling simulations of larger biological neural networks.
[52] Interactions amongst these oscillators are introduced by a simple algebraic form (such as a sine function) and collectively generate a dynamical pattern at the global scale.
The Kuramoto model is widely used to study oscillatory brain activity, and several extensions have been proposed that increase its neurobiological plausibility, for instance by incorporating topological properties of local cortical connectivity.
Simulations using the Kuramoto model with realistic long-range cortical connectivity and time-delayed interactions reveal the emergence of slow patterned fluctuations that reproduce resting-state BOLD functional maps, which can be measured using fMRI.
[64][65] It has recently been proposed that even if phases are not aligned across trials, induced activity may still cause event-related potentials because ongoing brain oscillations may not be symmetric and thus amplitude modulations may result in a baseline shift that does not average out.
[9] Neuronal oscillations became a hot topic in neuroscience in the 1990s when the studies of the visual system of the brain by Gray, Singer and others appeared to support the neural binding hypothesis.
Neural oscillations could create periodic time windows in which input spikes have larger effect on neurons, thereby providing a mechanism for decoding temporal codes.
Purely theoretical formulations of the binding-by-synchrony hypothesis were proposed first,[80] but subsequently extensive experimental evidence has been reported supporting the potential role of synchrony as a relational code.
[81] The functional role of synchronized oscillatory activity in the brain was mainly established in experiments performed on awake kittens with multiple electrodes implanted in the visual cortex.
[82] Since then, numerous studies have replicated these findings and extended them to different modalities such as EEG, providing extensive evidence of the functional role of gamma oscillations in visual perception.
[98] It has been proposed that motor commands in the form of travelling waves can be spatially filtered by the descending fibres to selectively control muscle force.
[99] Simulations have shown that ongoing wave activity in cortex can elicit steady muscle force with physiological levels of EEG-EMG coherence.
In support, it was shown that these movement discontinuities are directly correlated to oscillatory activity in a cerebello-thalamo-cortical loop, which may represent a neural mechanism for the intermittent motor control.
It is argued that tremors are likely to be multifactorial in origin, with contributions from neural oscillations in the central nervous systems, but also from peripheral mechanisms such as reflex loop resonances.
The thalamic loss of input allows the frequency of the thalamo-cortical column to slow into the theta or delta band as identified by MEG and EEG by machine learning.
[116][117] In particular, some forms of BCI allow users to control a device by measuring the amplitude of oscillatory activity in specific frequency bands, including mu and beta rhythms.