C-squares
C-squares (acronym for the Concise Spatial QUery And REpresentation System) is a system of spatially unique, location-based identifiers (geocodes) for areas on the surface of the earth, represented as cells from a latitude- and longitude-based Discrete Global Grid at a hierarchical set of resolution steps, obtained by progressively subdividing 10×10 degree World Meteorological Organization squares; the term "c-square" is also available for use to designate any component cell of the grid.
Individual cell identifiers incorporate literal values of latitude and longitude in an interleaved notation (producing grid resolutions of 10, 1, 0.1 degrees, etc.
The c-squares method was developed by Tony Rees at CSIRO Oceans and Atmosphere in Australia (then "CSIRO Marine Research") in 2001–2, initially as a method for spatial indexing, rapid query, and compact storage and visualization of dataset spatial "footprints" in an agency-specific metadata directory (data catalogue);[1] it was first publicly announced at the 2002 "EOGEO" Technical Workshop held at Ispra, Italy in May 2002.
[14] [a] The system name "c-squares" was chosen because it can be represented as an acronym (for "concise spatial query and representation system") and also because it signals that this method belongs to a notional group of similarly named, latitude-longitude gridded subdivisions of the Globe that includes World Meteorological Organization Squares and Marsden squares, and contrasts with other tessellations of the Globe that use different shaped basic units such as rectangles, triangles, diamonds, and hexagons (for examples refer e.g. Sahr et al., 2003[16]).
Such queries are computationally expensive so it can be beneficial to pre-process (index) the data in some manner that reduces the inherent dimensionality from two to one dimension, for example as labelled cells of a grid.
C-squares is an example of such a grid where the cell identifiers are designed to be human- as well as machine-readable, and to be concordant with recognizable and commonly intervals of latitude and longitude.
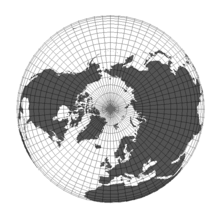
A potential disadvantage of "equal angle" grids (the class that includes c-squares), which are based on standardised units of latitude and longitude, is that the length of the "sides" and the shape (and area) of the grid cells is not constant on the ground (the height remains approximately constant but the width varies with latitude), and some particular effects are noticeable at the poles, where the cells become 3- rather than 4-sided in practice (refer illustration).
These disadvantages can be offset by the advantages that data transformation in and out of grid notation can be accomplished by relatively straightforward steps, the results are congruent with conventional maps that show intervals of latitude and longitude, and the concepts of (for example) "1-degree squares" and "0.5 degree squares" may have familiarity and meaning to human users, in a way that non-square, purely mathematically derived shapes and sizes (based upon some form of spherical trigonometry) may not.
Cell size is typically selected to suit the nature (granularity and volume) of the data to be encoded, the overall spatial extent of the area in question (e.g. global to local), the desired spatial resolution of the resulting grid (smallest features/areas that can be differentiated from each other), and the computing resources available (numbers of cells to cover the same area increase by either ×4 or ×25 with each decrease in square size, either requiring an equivalent increase in computing resources or possibly slower addressing times).
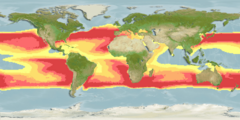
[20] A more sophisticated map produced using a larger number of available parameters is the colour-coded example at right (AquaMap, i.e. modelled distribution, for the ocean sunfish).
Commencing in 2006, an upgrade of the mapper incorporating the independently-written Xplanet software also allows the plots of supplied c-squares to be displayed on a user-rotatable and zoomable globe, which can offer a more realistic view for either Pacific Ocean- or polar- centred data than are possible with a flat map (e.g. equirectangular) projection.
This approach enables the filling of contiguous blocks of cells with an economy of characters in many cases (a form of data compression), that is useful for efficient storage and transfer of c-squares codes as required.
An additional aspect of c-squares noted by Larsen et al., 2009 and either implicit or explicit in other equivalent "data aggregation methods" is the use of such frameworks to "allow general level analyses without exposing the precise coordinates of potentially sensitive information".
[44] For example, real time data on the exact location of fishing vessels is frequently considered "commercial in confidence" to avoid release to competitors of the best fishing localities according to the nature of the resource, which may be continually moving, while for biodiversity data, the exact location of individuals or (for example) nests of rare species may again not be desirable to release to the public.