Capability curve
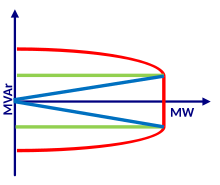
[citation needed] For a traditional synchronous generator the curve consists of multiple segments, each due to some physical constraint: The corners between the sections of the curve define the limits of the power factor (PF) that the generator can sustain at its nameplate capacity (the illustration has the PF ticks placed at 0.85 lagging and 0.95 leading angles).
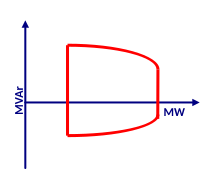
The minimum real power requirement means that the left-side of a D-curve is detached from the vertical axis.
The rectangular and D-shapes of the curve theoretically allow using the generator to provide voltage regulation services even when the unit does not produce any active energy (due to low wind or no sun), essentially working as a STATCOM, but not all designs include this feature.
Since the current state of these networks does not include the voltage regulation, the inverters in these units were operating at the unity power factor.
[9] For a synchronous generator operating inside its D-curve, the marginal cost of providing reactive power is close to zero.