Cardiac function curve

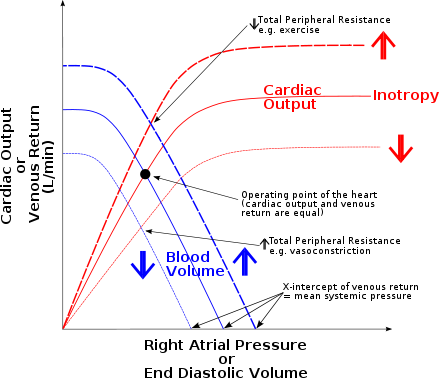
The higher pressures normally occur only in disease, in conditions such as heart failure, where the heart is unable to pump forward all the blood returning to it and so the pressure builds up in the right atrium and the great veins.

In vivo however, extrinsic factors such as an increase in activity of the sympathetic nerves, and a decrease in vagal tone cause the heart to beat more frequently and more forcefully.

This allows the heart to cope with the required cardiac output at a relatively low right atrial pressure.

[citation needed] In vivo sympathetic outflow within the myocardium is probably best described by the time honored description of the sinoatrial tree branching out to Purkinges fibers.

Parasympathetic inflow within the myocardium is probably best described by influence of the vagus nerve and spinal accessory ganglia.

The horizontal axis of Guyton diagram represents right atrial pressure or central venous pressure , and the vertical axis represents cardiac output or venous return . The red curve sloping upward to the right is the cardiac output curve , and the blue curve sloping downward to the right is the venous return curve . A steady state is formed at the point where the two curves meet.
Cardiac function curve in Frank–Starling's law, illustrating stroke volume (SV) as a function of preload
Cardiac function curve in Frank–Starling's law , illustrating stroke volume (SV) as a function of preload
The cardiac function curve expresses how systemic flow changes as a function of the central venous pressure ; it represents the Frank-Starling mechanism . The vascular function curve expresses how "central venous pressure" changes as a function of "systemic flow". Note that, for cardiac function curve, "central venous pressure" is the independent variable and "systemic flow" is the dependent variable; for vascular function curve, the opposite is true.