Characterization of nanoparticles
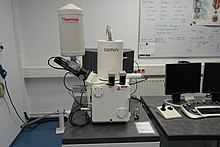
There is a wide range of instrumentation to measure these properties, including microscopy and spectroscopy methods as well as particle counters.
Nanotechnology is the manipulation of matter at the atomic scale to create materials, devices, or systems with new properties or functions.
Nanoparticles measure less than 100 nanometers in at least one of their external dimensions, and often have properties different from the bulk versions of their component materials, which make them technologically useful.
[6][7] An additional challenge is that sampling and laboratory procedures can perturb the nanoparticles' dispersion state, or bias the distribution of their other properties.
Additionally, microscopy is based on single-particle measurements, meaning that large numbers of individual particles must be characterized to estimate their bulk properties.
[12] Spectroscopy, which measures the particles' interaction with electromagnetic radiation as a function of wavelength, is useful for some classes of nanoparticles to characterize concentration, size, and shape.
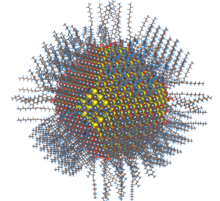
Semiconductor quantum dots are fluorescent and metal nanoparticles exhibit surface plasmon absorbances, making both amenable to ultraviolet–visible spectroscopy.
Size can be calculated from physical properties such as settling velocity, diffusion rate or coefficient, and electrical mobility.
For nanoparticles in suspension, techniques include dynamic light scattering, laser diffraction, field flow fractionation, nanoparticle tracking analysis, particle tracking velocimetry, size exclusion chromatography, centrifugal sedimentation, and atomic force microscopy.
[6][10] A closely related property is dispersion, a measure of the degree to which particles clump together into agglomerates or aggregates.
While the two terms are often used interchangeably, according to ISO nanotechnology definitions, an agglomerate is a reversible collection of particles weakly bound, for example by van der Waals forces or physical entanglement, whereas an aggregate is composed of irreversibly bonded or fused particles, for example through covalent bonds.
[9] Dispersion is a dynamic process strongly affected by properties of the particles themselves as well as their environment such as pH and ionic strength.
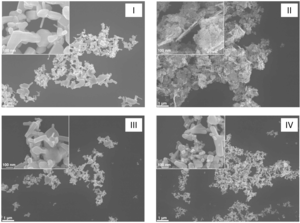
[13] Morphology refers to the physical shape of a particle, as well as its surface topography, for example, the presence of cracks, ridges, or pores.
[6] There are several indirect measurement techniques for airborne nanoparticles, which do not account for porosity and other surface irregularities and therefore may be inaccurate.
Nanoparticles can be collected onto a substrate and their external dimensions can be measured using electron microscopy, then converted to surface area using geometric relations.
[9] Analytical techniques for solubility quantitatively measure total elemental concentration in a sample, and do not discriminate between dissolved or solid forms.
[9] Manufacturers and users of nanoparticles may perform characterization of their products for process control or verification and validation purposes.
It is advantageous to minimize heterogeneity during the initial synthesis, stabilization, and functionalization processes, rather than through downstream purification steps that decrease yield.
[8] By contrast, characterization is especially important for nanomedicines, as their efficacy and safety depends strongly on critical properties such as particle size distribution, chemical composition, and the kinetics of drug loading and release.
[13] The properties of a nanoparticle, such as size distribution and agglomeration state, can change as a material is prepared and used in toxicology studies.
The "as-received" or "as-generated" properties refer to the material's state when received from the manufacturer or synthesized in the laboratory.
The properties may again be different at the point of interaction with the organism's tissues due to biodistribution and physiological clearance mechanisms.
[19] The U.S. National Institute for Occupational Safety and Health developed a Technical Report: Occupational Exposure Sampling for Engineered Nanomaterials [20] which contains guidance for workplace sampling for three engineered nanomaterials: carbon nanotubes and nanofibers, silver, and titanium dioxide, each of which have an elemental mass-based NIOSH Recommended Exposure Limit (REL).
In addition, field-portable direct reading instruments can be used for continuous recording of normal fluctuations in particle count, size distribution, and mass.
By documenting the workers' activities, data-logged results can then be used to identify workplace tasks or practices that contribute to any increase or spikes in the counts.
[3][24] Occupational exposure limits have not yet been developed for many of the large and growing number of engineered nanoparticles now being produced and used, as their hazards are not fully known.
Animal and cell-culture studies have shown that size and shape may be two major factors in their toxicological effects.
Reference materials for nanoparticles can reduce measurement error that can contribute to uncertainty in their hazard properties in risk assessment.
[40] Reference materials can also be used for calibrating equipment used in nanoparticles characterization, for statistical quality control, and for comparing experiments run in different laboratories.
[40] Measurement conditions must also be specified, because properties such as size and dispersion state may change based on them, especially when there is a thermodynamic equilibrium between particlulate and dissolved matter.