Climate of Uranus
The climate of Uranus is heavily influenced by both its lack of internal heat, which limits atmospheric activity, and by its extreme axial tilt, which induces intense seasonal variation.
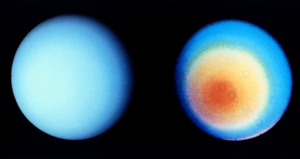
[6] In 1986 Voyager 2 discovered that the visible southern hemisphere of Uranus can be subdivided into two regions: a bright polar cap and dark equatorial bands (see figure on the right).
A narrow band straddling the latitudinal range from −45 to −50 degrees is the brightest large feature on Uranus's visible surface.
[7] Thus, Uranus appeared to be asymmetric: bright near the south pole and uniformly dark in the region north of the southern collar.
[9] The visible latitudinal structure of Uranus is different from that of Jupiter and Saturn, which demonstrate multiple narrow and colorful bands.
[1] In addition to large-scale banded structure, Voyager 2 observed ten small bright clouds, most lying several degrees to the north from the collar.
[5] This implies that dark spots on the two ice giants are located at somewhat different pressure levels—the Uranian feature probably lies near 4 bar.
The dark color of UDS (as well as GDS) may be caused by thinning of the underlying hydrogen sulfide or ammonium hydrosulfide clouds.
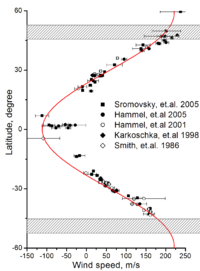
[5] The tracking of numerous cloud features allowed determination of zonal winds blowing in the upper troposphere of Uranus.
[1][7] Wind speeds increase with the distance from the equator, reaching zero values near ±20° latitude, where the troposphere's temperature minimum is located.
[3] In addition, both poles demonstrate elevated brightness in the microwave part of the spectrum,[19] whereas the polar stratosphere is known to be cooler than the equatorial one.
Although Uranus is known to have a bright south polar region, the north pole is fairly dim, which is incompatible with the model of the seasonal change outlined above.
[20] During its previous northern solstice in 1944, Uranus displayed elevated levels of brightness, which suggests that the north pole was not always so dim.
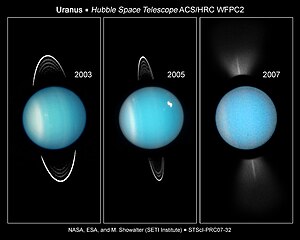
[19] Finally in the 1990s, as Uranus moved away from its solstice, Hubble and ground-based telescopes revealed that the south polar cap darkened noticeably (except the southern collar, which remained bright),[8] whereas the northern hemisphere demonstrated increasing activity,[4] such as cloud formations and stronger winds, having bolstered expectations that it would brighten soon.
[20] Near the summer and winter solstices, Uranus's hemispheres lie alternately either in full glare of the Sun's rays or facing deep space.
The brightening of the sunlit hemisphere is thought to result from the local thickening of the methane clouds and haze layers located in the troposphere.
[8] The variation of the microwave emission from Uranus is probably caused by changes in the deep tropospheric circulation, because thick polar clouds and haze may inhibit convection.
The total power radiated by Uranus in the far infrared (i.e. heat) part of the spectrum is 1.06 ± 0.08 times the solar energy absorbed in its atmosphere.
Another hypothesis is that some form of barrier exists in Uranus's upper layers which prevents the core's heat from reaching the surface.