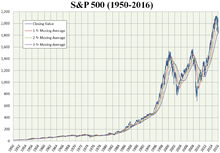
Closing milestones of the S&P 500
[1] While the index saw a degree of recovery in subsequent years, closing at 18.09 in February 1937, it would not surpass its pre-Great Depression record until its closure at 32.31 in September 1954.
The subsequent 1970s bear market and early 1980s bull depression would slow growth of the index for over a decade.
[2] The subsequent stock market crash on October 19, 1987 (Black Monday) saw the index lose 20.47% of its value, its highest daily percentage loss to date.
[6][7] While a brief bull market in 2007 saw the index achieve new record closures of 1,530.23 on May 30 through to 1,565.15 on October 9, the bursting of the United States housing bubble caused mortgage-backed securities to collapse in value, precipitating a financial crisis and global recession.
These events, including the bankruptcy of Lehman Brothers, caused substantial market volatility that resulted in the S&P 500 closing up or down 3 percent or more 29 times in the fourth quarter of 2008.
[9] In the year since its record closure of 1,565.15 in October 2007, the index fell by over 50% to 752.44 on November 20, 2008, its lowest point since March 1997.
[20] On March 28 and April 10, 2013, the index's October 2007 closing and intraday trading highs, respectively, were surpassed for the first time, recovering all losses incurred during the Great Recession.
[32][33] High market growth in the next two quarters reversed the prior year's losses by April 2019,[34][35] with the index surpassing 3,000 on July 10.
[46] 2021 also marked the first year since 2005 when the S&P 500 beat the other two closely watched U.S. stock indices: the Dow Jones Industrial Average and the Nasdaq Composite.