Community fingerprinting
Rather than directly identifying or counting individual cells in an environmental sample, these techniques show how many variants of a gene are present.
[1] The advantages of community fingerprinting are that it can be performed quickly and relatively cheaply, and the analyses can accommodate a large number of samples simultaneously.
Also, community fingerprinting does not directly identify taxa in an environmental sample, though the data output from certain techniques (e.g. DGGE) can be analyzed further if one desires identification.
For example, organisms that are scarce in the original total DNA sample will not be amplified enough to be detected in the final analysis.
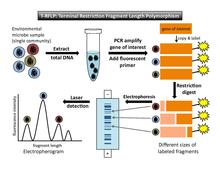
Liu et al.[7] cite other possible factors that may distort results, including "differences in gene copy number between species and biases introduced during cell lysis, DNA extraction, and PCR amplification" (p. 4521).
For those who seek detailed technical information, Marsh[2] provides a catalog of potential biases that could be introduced in each step of the T-RFLP process.
Disayathanoowat et al.[8] used T-RFLP to assess the microbial gut community, or microbiome, in two species of honeybees in Thailand.
After comparison of samples with known terminal restriction fragments (from a database built from cultures), they concluded that T-RFLP can be used effectively as a technique for monitoring changes in the phytoplankton community.
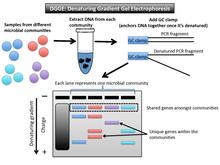
Denaturing gradient gel electrophoresis (DGGE) is a microbial fingerprinting technique that separates amplicons of roughly the same size based on sequence properties[1] (Figure 2).
For example, if the gene of interest is 16S rRNA, as it was when the technique was first described, the PCR-amplified fragments will be in the same vertical location because they are all roughly the same size.
[13] Another target gene may have greater variation in length, but the denaturant gradient uses a second element (of melting point) to further distinguish between the samples.
[14] The number of bands at differing horizontal positions can be used to estimate the level of biodiversity in that sample and infer phylogenetic affiliation.
This is beneficial in assessing microbial diversity due to the fact that the 16S rRNA gene does not vary much in size across bacterial phyla.
The DGGE gel provides a quick way of looking at biodiversity in a microbial sample and does not preclude the option of sequencing the bands of interest.
[10] The main disadvantage is that this is a qualitative assessment of biodiversity and one must sequence the genes in order to make inferences about the phylogenetic relatedness.
They obtained an initial assessment of microbial diversity in their environmental samples from soil maintained for 36 years at the various pH values.
They combined DGGE and hybridization techniques by probing the DNA fragments to obtain more detail about the natural populations.
The ambiguous overlapping bands were separated with cluster-specific radiolabelled probes, which yielded information of the relative abundance of the different genotypes in samples.
Ward et al.[14] examined cyanobacterial mat communities in a Yellowstone hot spring by using DGGE analysis of 16S rRNA gene segments of aerobic chemoorganotrophic populations.
Due to these biases, researchers often use this method on multiple samples from each community in order to get an average assessment.
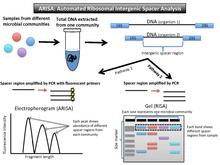
They cite several studies that have used this technique to fingerprint bacterial communities following such disturbances as antibiotic treatment, mercury stress and deforestation.
They also demonstrated the successful use of ARISA for characterizing fungal communities, which is an aspect of microbial ecology that remains to be fully explored.
Schloss et al.[19] conducted a study examining environmental variables and linking them to changes in the microbial ecology of a compost pile.
They took DNA samples and sequenced the 16S rRNA gene to identify community members at the different phases of the process.