Cryogenic electron tomography
Cryogenic electron tomography (cryoET) is an imaging technique used to reconstruct high-resolution (~1–4 nm) three-dimensional volumes of samples, often (but not limited to) biological macromolecules and cells.
As in other electron cryomicroscopy techniques, samples for cryoET (typically small cells such as Bacteria, Archaea, or viruses) are prepared in standard aqueous media and applied to an EM grid.
The grid is then plunged into a cryogen, for example liquid ethane, with sufficiently large specific heat that the rate of cooling is rapid enough that water molecules do not have time to rearrange into a crystalline lattice.
One of the most commonly cited benefits of cryoET is the ability to reconstruct 3D volumes of individual objects (proteins, cells, etc.)
[7] CryoET is considered to be an in situ method when used on an unperturbed cell or other system since plunge-freezing of sufficiently thin samples fixes the specimen in place fast enough to cause minimal changes to atomic positioning.
For this reason, most cryoET studies have focused on purified macromolecular complexes, viruses, or small cells such as those of many species of Bacteria and Archaea.
[9] Larger cells, and even tissues, can be prepared for cryoET by thinning, either by cryo-sectioning or by focused ion beam (FIB) milling.
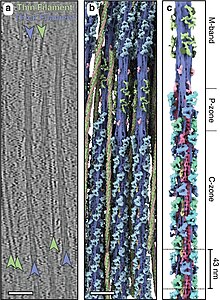
[13][14] Similar to single particle analysis, subtomogram averaging computationally combines images of identical objects to increase the signal-to-noise ratio.
The missing wedge is also a problem in 3D electron crystallography, where it is usually solved by merging multiple datasets that overlap each other or through symmetry expansion where possible.