Demographics of Hispanic and Latino Americans
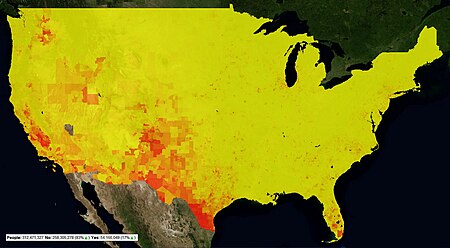
[1] The Latino population is much younger than the rest of the country, of no less than two dozen national origins and of every race, with a longer life expectancy than their fellow Americans, and geographically concentrated in the southwestern United States.
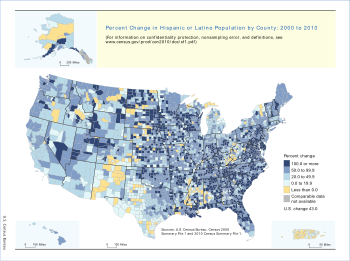
High rates of immigration and fertility have shaped the growth of the Hispanic and Latino population.
Central American Latinos come from El Salvador, Guatemala, Honduras, Nicaragua, Panama, Belize and Costa Rica.
The largest numbers of Hispanics with Central American origins can be found in California, Texas, and the DC Metropolitan area.
Latinos from South America come from Colombia, Venezuela, Peru, Ecuador, Chile, Bolivia and Paraguay.
Other Hispanic and Latino groups come from Spain, and the descendants of the colonial Spanish in Florida, Louisiana, and the US southwest.
[34] Often, Hispanic and Latino youth begin schooling without the necessary economic and social resources that other children have.
One frequent cause is their being the children of immigrant parents with low socioeconomic status and language barriers that result in a lack of knowledge about the U.S. education system.
The latter only lag non-Hispanic Whites by 1.3 years of schooling, and nearly tie African Americans, as seen in the table below.
Employment and earnings are a measure of labor market success, and depend on educational attainment.
The annual employment rate is defined as the percentage of individuals who worked any period of time during the calendar year.
Furthermore, nativity plays a major role in employment rates because U.S. born Hispanics are more accustomed to the U.S. labor market.
A report released by the Census Bureau in 2003 estimated that the average lifetime earnings of Hispanics with an advanced degree are $500,000 less than those of non-Hispanic whites with an equivalent education.