Demographics of London
In 2011, a historic tipping point occurred with the release of the 2011 census indicating that the White British population, which had before been the majority, was now no longer a majority of the city's population, although it remained by far the largest single ethnic group.
[16] Eurostat has developed a harmonising standard for comparing metropolitan areas in the European Union and the population of the London Larger Urban Zone is 11,917,000; it occupies an area of 8,920 square kilometres (3,440 sq mi).
[17] For the overwhelming majority of London's history, the population of the city was ethnically homogenous with the population being of White British ethnic origin,[18] with small clusters of minority groups such as Jewish people, most notably in areas of the East End.
[19] The following table shows the ethnic group of respondents from estimates in 1971 and in the 1991 – 2021 censuses in Greater London.
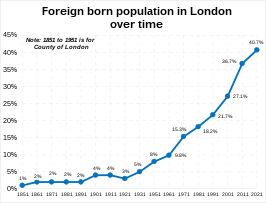
The 2021 census recorded that 3,575,740 people or 40.7% of London's population are foreign-born (including 27.9% born in a non-European country).
NOTE: The sub-categories included for each continent may not add up to their respective total amount because the sub categories are only supposed to show the most numerous country of birth from said area.According to the 2011 Census, 6,083,420 or 77.9% of London's population aged 3 and over spoke English as a main language, with a further 1,406,912 (19.8%) speaking it as a second language or well to very well.
[47] This shows also great challenges for TfL and other government services, for example most ticket vending machines use only English, French and up to 2 other western Europe hemisphere languages, while as shown below most demand is for Indian languages, Polish, etc.
The most common main languages spoken in Greater London according to the 2011 and 2021 censuses are shown below.
These changes are influenced by various factors, including immigration, generational attitudes, and broader social trends.
Note: The order of options for the census question on national identity was changed between 2011 and 2021.