Dose–response relationship
Studying dose response, and developing dose–response models, is central to determining "safe", "hazardous" and (where relevant) beneficial levels and dosages for drugs, pollutants, foods, and other substances to which humans or other organisms are exposed.
The U.S. Environmental Protection Agency has developed extensive guidance and reports on dose–response modeling and assessment, as well as software.
In populations, dose–response relationships can describe the way groups of people or organisms are affected at different levels of exposure.
However, stimuli (such as temperatures or radiation) may also affect physiological processes beyond sensation (and even give the measurable response of death).
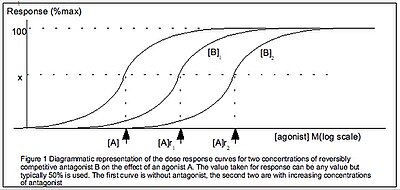
A dose–response curve is a coordinate graph relating the magnitude of a dose (stimulus) to the response of a biological system.
[5] Empirical models based on nonlinear regression are usually preferred over the use of some transformation of the data that linearizes the dose-response relationship.
Specific to response to doses of radiation the Health Physics Society (in the United States) has published a documentary series on the origins of the linear no-threshold (LNT) model though the society has not adopted a policy on LNT."
Logarithmic dose–response curves are generally sigmoidal-shape and monotonic and can be fit to a classical Hill equation.
The Hill equation is a logistic function with respect to the logarithm of the dose and is similar to a logit model.
The Hill equation can be used to describe dose–response relationships, for example ion channel-open-probability vs. ligand concentration.
[10] The shape of dose-response curve typically depends on the topology of the targeted reaction network.
[11] The concept of linear dose–response relationship, thresholds, and all-or-nothing responses may not apply to non-linear situations.
[citation needed] Schild analysis may also provide insights into the effect of drugs.