Deformation (engineering)
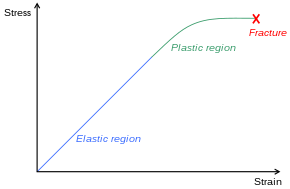
In engineering, deformation (the change in size or shape of an object) may be elastic or plastic.
Elasticity in materials occurs when applied stress does not surpass the energy required to break molecular bonds, allowing the material to deform reversibly and return to its original shape once the stress is removed.
Above the yield point, some degree of permanent distortion remains after unloading and is termed plastic deformation.
Internal forces (in this case at right angles to the deformation) resist the applied load.
The image to the right shows the engineering stress vs. strain diagram for a typical ductile material such as steel.
Elastomers and shape memory metals such as Nitinol exhibit large elastic deformation ranges, as does rubber.
Soft thermoplastics have a rather large plastic deformation range as do ductile metals such as copper, silver, and gold.
An example of a material with a large plastic deformation range is wet chewing gum, which can be stretched to dozens of times its original length.
During necking, the material can no longer withstand the maximum stress and the strain in the specimen rapidly increases.
In long, slender structural elements — such as columns or truss bars — an increase of compressive force F leads to structural failure due to buckling at lower stress than the compressive strength.
A break occurs after the material has reached the end of the elastic, and then plastic, deformation ranges.
The material is experiencing a stress defined to be the ratio of the force to the cross sectional area of the bar, as well as an axial elongation: Subscript 0 denotes the original dimensions of the sample.
Note that for engineering purposes we often assume the cross-section area of the material does not change during the whole deformation process.
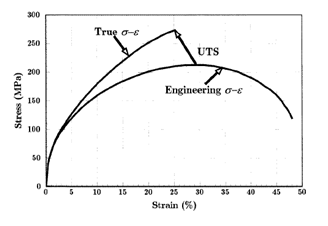
The difference between the true and engineering stresses and strains will increase with plastic deformation.
Because engineering stress is proportional to the force applied along the sample, the criterion for necking formation can be set as
This analysis suggests nature of the ultimate tensile strength (UTS) point.
The work strengthening effect is exactly balanced by the shrinking of section area at UTS point.
After the formation of necking, the sample undergoes heterogeneous deformation, so equations above are not valid.
[3] Since we disregard the change of area during deformation above, the true stress and strain curve should be re-derived.
For deriving the stress strain curve, we can assume that the volume change is 0 even if we deformed the materials.
Additionally, based on the true stress-strain curve, we can estimate the region where necking starts to happen.
Since necking starts to appear after ultimate tensile stress where the maximum force applied, we can express this situation as below: so this form can be expressed as below: It indicates that the necking starts to appear where reduction of area becomes much significant compared to the stress change.
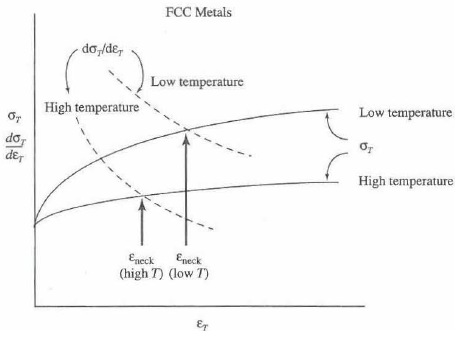
3) Based on the true stress-strain curve and its derivative form, we can estimate the strain necessary to start necking.
In case of FCC metals, both of the stress-strain curve at its derivative are highly dependent on temperature.
Therefore, at higher temperature, necking starts to appear even under lower strain value.
All of these properties indicate the importance of calculating the true stress-strain curve for further analyzing the behavior of materials in sudden environment.
4) A graphical method, so-called "Considere construction", can help determine the behavior of stress-strain curve whether necking or drawing happens on the sample.
diagram and secant line, we can determine whether the materials show drawing or necking.
After this value, the slope becomes smaller than the secant line where necking starts to appear.
In reality, many materials that undergo large elastic and plastic deformations, such as steel, are able to absorb stresses that would cause brittle materials, such as glass, with minimal plastic deformation ranges, to break.