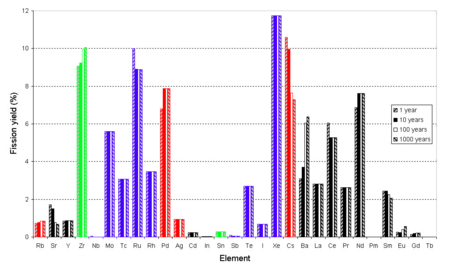
If a graph of the mass or mole yield of fission products against the atomic number of the fragments is drawn then it has two peaks, one in the area zirconium through to palladium and one at xenon through to neodymium.
This is because the fission event causes the nucleus to split in an asymmetric manner,[1] as nuclei closer to magic numbers are more stable.
In general, the higher the energy of the state that undergoes nuclear fission, the more likely a symmetric fission is, hence as the neutron energy increases and/or the energy of the fissile atom increases, the valley between the two peaks becomes more shallow; for instance, the curve of yield against mass for Pu-239 has a more shallow valley than that observed for U-235, when the neutrons are thermal neutrons.
Joint Evaluated Fission and Fusion File, Incident-neutron data, http://www-nds.iaea.org/exfor/endf00.htm, 2 October 2006; see also A. Koning, R. Forrest, M. Kellett, R. Mills, H. Henriksson, Y. Rugama, The JEFF-3.1 Nuclear Data Library, JEFF Report 21, OECD/NEA, Paris, France, 2006, ISBN 92-64-02314-3.
Decays with half lives longer than a century are marked with a single asterisk (*), while decays with a half life longer than a hundred million years are marked with two asterisks (**).
Fission product yields by mass for thermal neutron fission of U-235, Pu-239, a combination of the two typical of current nuclear power reactors, and U-233 used in the
thorium fuel cycle