Food web
Autotrophs and heterotrophs come in all sizes, from microscopic to many tonnes - from cyanobacteria to giant redwoods, and from viruses and bdellovibrio to blue whales.
Elton organized species into functional groups, which was the basis for Raymond Lindeman's classic and landmark paper in 1942 on trophic dynamics.
[1] Scaling laws, for example, predict a relationship between the topology of food web predator-prey linkages and levels of species richness.
Yet recent studies have shown that food webs from a wide range of terrestrial, freshwater, and marine communities share a remarkable list of patterns.
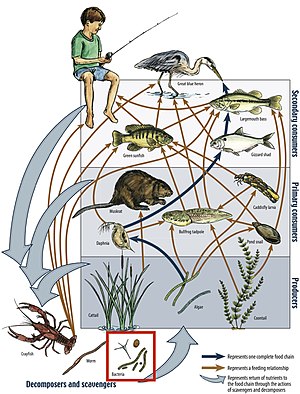
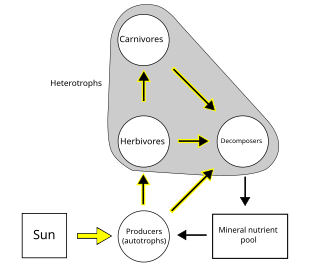
A food web depicts a collection of polyphagous heterotrophic consumers that network and cycle the flow of energy and nutrients from a productive base of self-feeding autotrophs.
For example, herbivores generally have an abundance of vegetative resources, which meant that their populations were largely controlled or regulated by predators.
[25] Another example of a multitrophic interaction is a trophic cascade, in which predators help to increase plant growth and prevent overgrazing by suppressing herbivores.
[26] The field of chemical ecology has elucidated multitrophic interactions that entail the transfer of defensive compounds across multiple trophic levels.
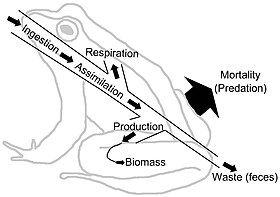
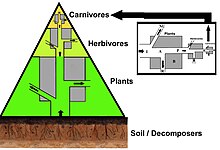
[33] Energy flow "typically includes production, consumption, assimilation, non-assimilation losses (feces), and respiration (maintenance costs).
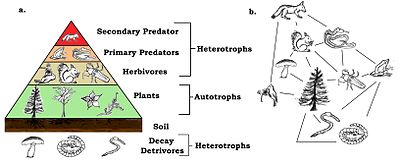
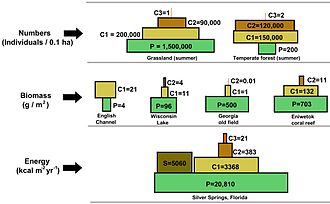
They can depict different numerical properties of ecosystems, including numbers of individuals per unit of area, biomass (g/m2), and energy (k cal m−2 yr−1).
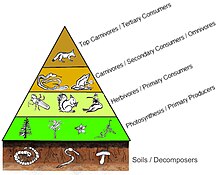
The emergent pyramidal arrangement of trophic levels with amounts of energy transfer decreasing as species become further removed from the source of production is one of several patterns that is repeated amongst the planets ecosystems.
[49] Aquatic predators also tend to have a lower death rate than the smaller consumers, which contributes to the inverted pyramidal pattern.
Ecologists employ stoichiometry to analyze the ratios of the main elements found in all organisms: carbon (C), nitrogen (N), phosphorus (P).
These characterizations stem from the ecosystem concept, which assumes that the phenomena under investigation (interactions and feedback loops) are sufficient to explain patterns within boundaries, such as the edge of a forest, an island, a shoreline, or some other pronounced physical characteristic.
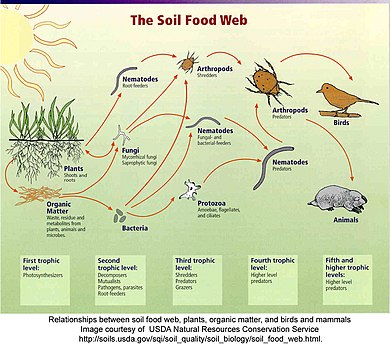
[66][67][68] In a detrital web, plant and animal matter is broken down by decomposers, e.g., bacteria and fungi, and moves to detritivores and then carnivores.
[70] "Detritus can be broadly defined as any form of non-living organic matter, including different types of plant tissue (e.g. leaf litter, dead wood, aquatic macrophytes, algae), animal tissue (carrion), dead microbes, faeces (manure, dung, faecal pellets, guano, frass), as well as products secreted, excreted or exuded from organisms (e.g. extra-cellular polymers, nectar, root exudates and leachates, dissolved organic matter, extra-cellular matrix, mucilage).
"[54]: 585 Ecologists collect data on trophic levels and food webs to statistically model and mathematically calculate parameters, such as those used in other kinds of network analysis (e.g., graph theory), to study emergent patterns and properties shared among ecosystems.
Microcosm studies are used to simplify food web research into semi-isolated units such as small springs, decaying logs, and laboratory experiments using organisms that reproduce quickly, such as daphnia feeding on algae grown under controlled environments in jars of water.
These formulas are the basis for comparing and investigating the nature of non-random patterns in the structure of food web networks among many different types of ecosystems.
[73][74] Scaling laws, complexity, chaos, and pattern correlates are common features attributed to food web structure.
[81]: 12917 These concepts were derived and stimulated through the suggestion that complexity leads to stability in food webs, such as increasing the number of trophic levels in more species rich ecosystems.
This hypothesis was challenged through mathematical models suggesting otherwise, but subsequent studies have shown that the premise holds in real systems.
[77][74] At different levels in the hierarchy of life, such as the stability of a food web, "the same overall structure is maintained in spite of an ongoing flow and change of components.
[79][83] Complexity in the life sciences (or biocomplexity) is defined by the "properties emerging from the interplay of behavioral, biological, physical, and social interactions that affect, sustain, or are modified by living organisms, including humans".
Complexity explains many principals pertaining to self-organization, non-linearity, interaction, cybernetic feedback, discontinuity, emergence, and stability in food webs.
These regions of high link density are often referred to as cliques, hubs, compartments, cohesive sub-groups, or modules...Within food webs, especially in aquatic systems, nestedness appears to be related to body size because the diets of smaller predators tend to be nested subsets of those of larger predators (Woodward & Warren 2007; YvonDurocher et al. 2008), and phylogenetic constraints, whereby related taxa are nested based on their common evolutionary history, are also evident (Cattin et al.
[66][67] "This leads to anomalies, such as food web calculations determining that an ecosystem can support one half of a top carnivore, without specifying which end.
[90] Food webs serve as a framework to help ecologists organize the complex network of interactions among species observed in nature and around the world.
"[91]: 143 The earliest graphical depiction of a food web was by Lorenzo Camerano in 1880, followed independently by those of Pierce and colleagues in 1912 and Victor Shelford in 1913.
Many theoretical ecologists, including Sir Robert May[103] and Stuart Pimm,[104] were prompted by this discovery and others to examine the mathematical properties of food webs.