Greenhouse gas
[3][4] The five most abundant greenhouse gases in Earth's atmosphere, listed in decreasing order of average global mole fraction, are:[5][6] water vapor, carbon dioxide, methane, nitrous oxide, ozone.
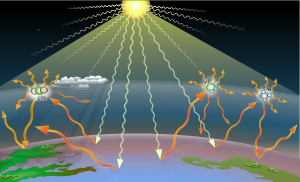
Water vapor causes about half of the greenhouse effect, acting in response to other gases as a climate change feedback.
[10] The vast majority of carbon dioxide emissions by humans come from the burning of fossil fuels,[11] with remaining contributions from agriculture and industry.
Because their molecules contain two atoms of the same element, they have no asymmetry in the distribution of their electrical charges,[20] and so are almost totally unaffected by infrared thermal radiation,[21] with only an extremely minor effect from collision-induced absorption.
On the other hand, carbon dioxide (0.04%), methane, nitrous oxide and even less abundant trace gases account for less than 0.1% of Earth's atmosphere, but because their molecules contain atoms of different elements, there is an asymmetry in electric charge distribution which allows molecular vibrations to interact with electromagnetic radiation.
When Earth's energy balance is shifted, its surface becomes warmer or cooler, leading to a variety of changes in global climate.
[26] Radiative forcing is a metric calculated in watts per square meter, which characterizes the impact of an external change in a factor that influences climate.
[31] K&T (1997) used 353 ppm CO2 and calculated 125 W/m2 total clear-sky greenhouse effect; relied on single atmospheric profile and cloud model.
Schmidt (2010) used 1980 climatology with 339 ppm CO2 and 155 W/m2 total greenhouse effect; accounted for temporal and 3-D spatial distribution of absorbers.
While local water vapor concentrations can be affected by developments such as irrigation, it has little impact on the global scale due to its short residence time of about nine days.
[36] Thus, local atmospheric concentration of water vapor varies from less than 0.01% in extremely cold regions up to 3% by mass in saturated air at about 32 °C.
[37] Global warming potential (GWP) is a measure of how much heat a greenhouse gas traps in the atmosphere over a specific time period, relative to carbon dioxide (CO2).
[43] Since the 1980s, greenhouse gas forcing contributions (relative to year 1750) are also estimated with high accuracy using IPCC-recommended expressions derived from radiative transfer models.
The table below shows the most influential long-lived, well-mixed greenhouse gases, along with their tropospheric concentrations and direct radiative forcings, as identified by the Intergovernmental Panel on Climate Change (IPCC).
[57] As of year 2014, fossil CO2 emitted as a theoretical 10 to 100 GtC pulse on top of the existing atmospheric concentration was expected to be 50% removed by land vegetation and ocean sinks in less than about a century, as based on the projections of coupled models referenced in the AR5 assessment.
[57] In the high-emission scenarios, the effectiveness of carbon sinks will be lower, increasing the atmospheric fraction of CO2 even though the raw amount of emissions absorbed will be higher than in the present.
Individual atoms or molecules may be lost or deposited to sinks such as the soil, the oceans and other waters, or vegetation and other biological systems, reducing the excess to background concentrations.
[68][69] Estimates in 2023 found that the current carbon dioxide concentration in the atmosphere may be the highest it has been in the last 14 million years.
[70] However the IPCC Sixth Assessment Report estimated similar levels 3 to 3.3 million years ago in the mid-Pliocene warm period.
Indirect methods calculate emissions of greenhouse gases based on related metrics such as fossil fuel extraction.
[57] There are several different methods of measuring carbon dioxide concentrations in the atmosphere, including infrared analyzing and manometry.
[74] Methane and nitrous oxide are measured by other instruments, such as the range-resolved infrared differential absorption lidar (DIAL).
[57] The Annual Greenhouse Gas Index (AGGI) is defined by atmospheric scientists at NOAA as the ratio of total direct radiative forcing due to long-lived and well-mixed greenhouse gases for any year for which adequate global measurements exist, to that present in year 1990.
As such, NOAA states that the AGGI "measures the commitment that (global) society has already made to living in a changing climate.
[13] If current emission rates continue then temperature rises will surpass 2.0 °C (3.6 °F) sometime between 2040 and 2070, which is the level the United Nations' Intergovernmental Panel on Climate Change (IPCC) says is "dangerous".
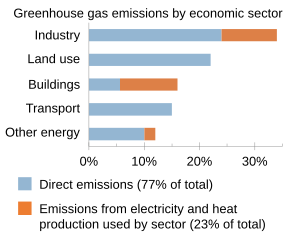
In the industrial era, human activities have added greenhouse gases to the atmosphere, mainly through the burning of fossil fuels and clearing of forests.
"To get on track for limiting global warming to 1.5°C, global annual GHG emissions must be reduced by 45 per cent compared with emissions projections under policies currently in place in just eight years, and they must continue to decline rapidly after 2030, to avoid exhausting the limited remaining atmospheric carbon budget.
[105][106] In the early 20th century, researchers realized that greenhouse gases in the atmosphere made Earth's overall temperature higher than it would be without them.
[107][108] During the late 20th century, a scientific consensus evolved that increasing concentrations of greenhouse gases in the atmosphere cause a substantial rise in global temperatures and changes to other parts of the climate system,[109] with consequences for the environment and for human health.
[110] While Venus has been described as the ultimate end state of runaway greenhouse effect, such a process would have virtually no chance of occurring from any increases in greenhouse gas concentrations caused by humans,[111] as the Sun's brightness is too low and it would likely need to increase by some tens of percents, which will take a few billion years.